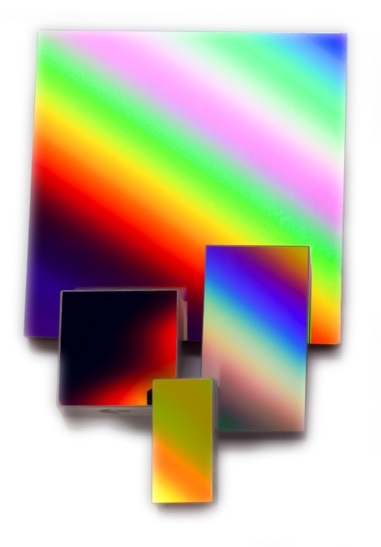
Diffraction Gratings
Stock Diffraction Gratings
Diffraction gratings are significant in facilitating transmission or reflection in optical applications. At OPCO Solutions, we have more than 40 years of optical design and manufacturing experience. Our experts can assist you in determining which grating best suits the requirements of your project.
Benefits of Stock Diffraction Gratings
Even though stock diffraction grating masters are based on decades-old designs, many are still in operation today. For instance, replicated diffraction gratings are still found in modern monochromators, spectrometers, and other optical devices that use standard parts. Grating masters also help produce stock diffraction gratings that provide high efficiency at lower costs. Replicating grating masters eliminates expenses associated with custom tooling, a requirement for creating custom diffraction grating masters.
Stock diffraction gratings offer a variety of benefits, including:
- Linear wavelength dispersion
- No absorption issues
- Increased efficiency
- Cost-effectiveness
Our engineers, technicians, and scientists have helped customers overcome spectrometer design obstacles by providing them with affordable components like replicated diffraction gratings.
For more information, please read our resource page Stock / Standard vs Custom Diffraction Gratings
Replicated Diffraction Gratings From Existing Grating Masters
Master gratings are first-run diffraction gratings refined to a final product, many of which were developed decades ago. In the 1940s, new technology allowed manufacturers to replicate master gratings onto other substrates, resulting in high-efficiency, cost-effective optical solutions.
Before the development of efficient replication techniques, all diffraction gratings were simply master gratings. This practice was difficult and time-consuming due to variations in groove size, spacing, and other flaws that could result in out-of-spec gratings. Thanks to replication technology, replicas can be as identical to the master as possible, exhibiting the same size, shape, and topography without the labor-intensive process.
The performance of the replicas largely depends on the quality of the replication method and master grating. Every replica should be as consistent with the master as possible to ensure high performance. Replicating from an existing grating master is ideal for lowering costs incurred by custom tooling.
Replication Process for Diffraction Gratings
Compared to producing a new grating master every time, it is much easier to replicate diffraction gratings from a master grating. The process begins with the fabrication and verification of a master grating, followed by applying a releasing agent to its surface. On top of this goes the epoxy and the replica substrate. The epoxy is cured and the replica is released. Unless it is a transmission grating, a reflective coating should be added to the surface of the replica.
Given that high-quality epoxies, substrates, and coatings are used, this technique yields excellent diffraction gratings that don’t deviate from the existing master grating. As a result, the replicas have a similar performance to the master gratings.
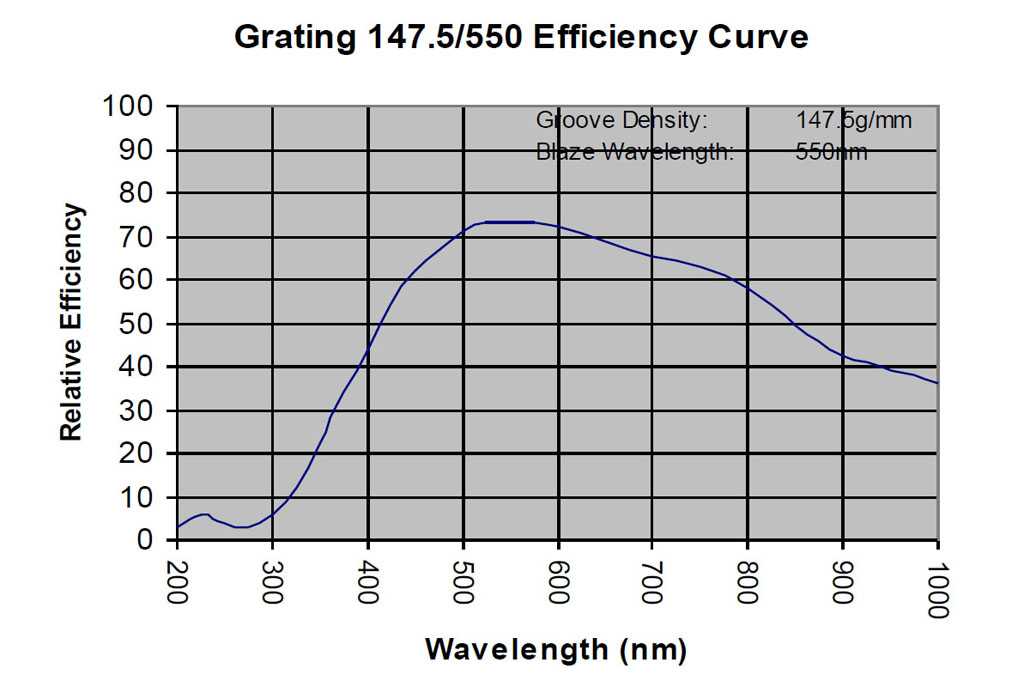
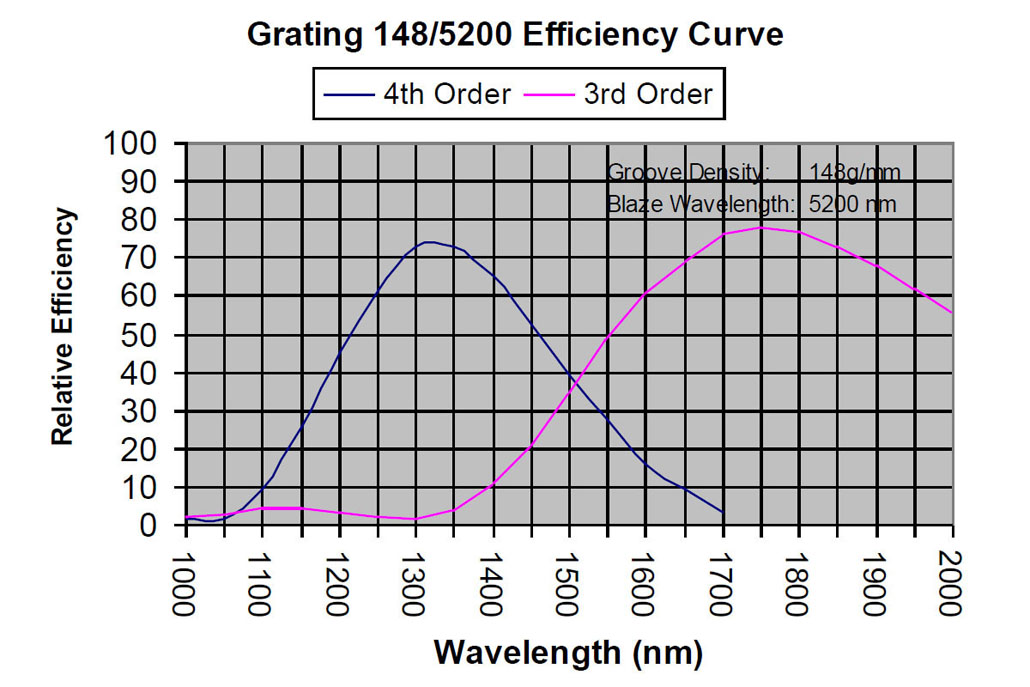
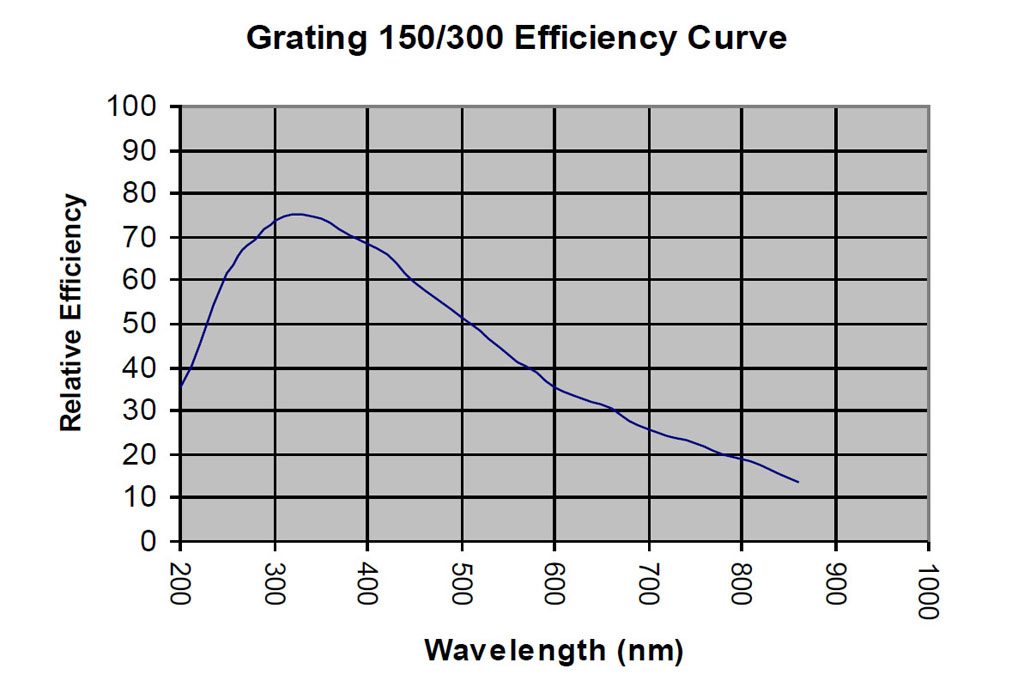
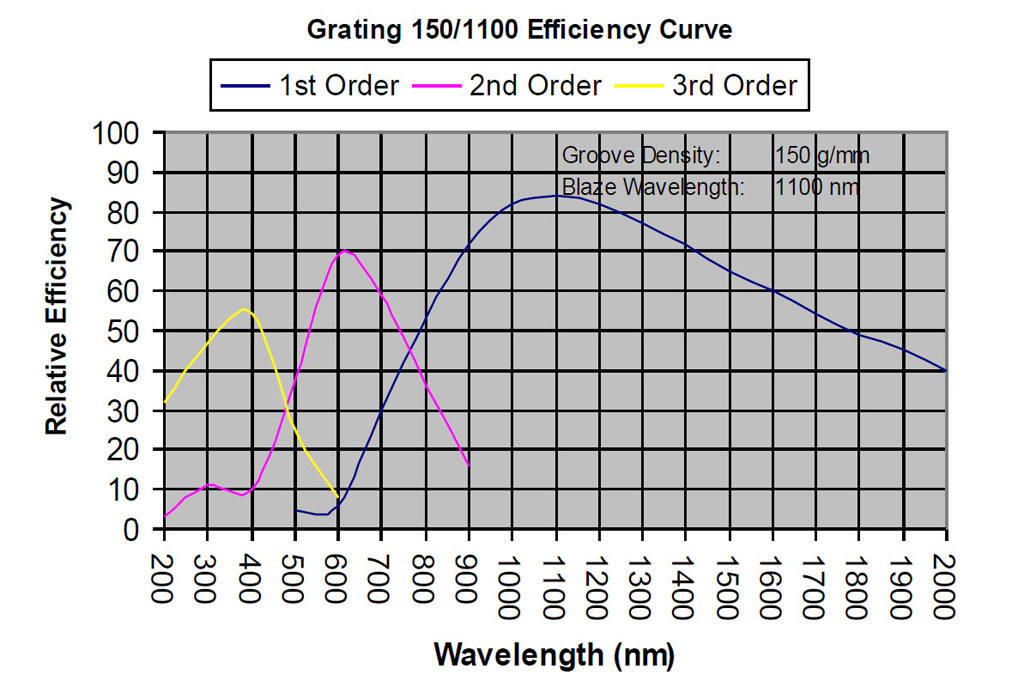
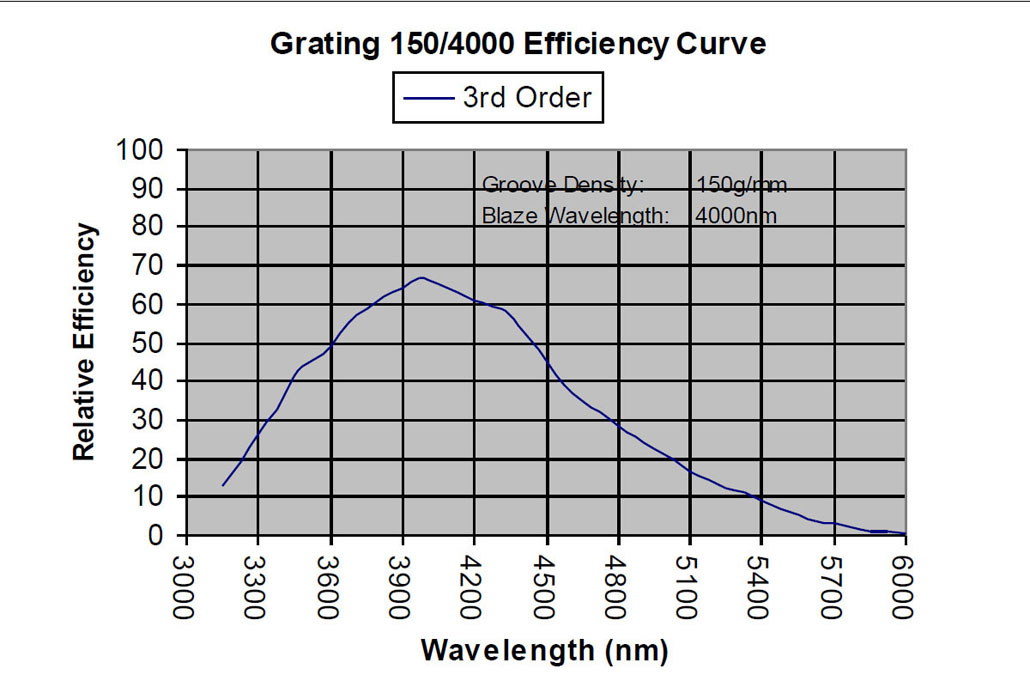
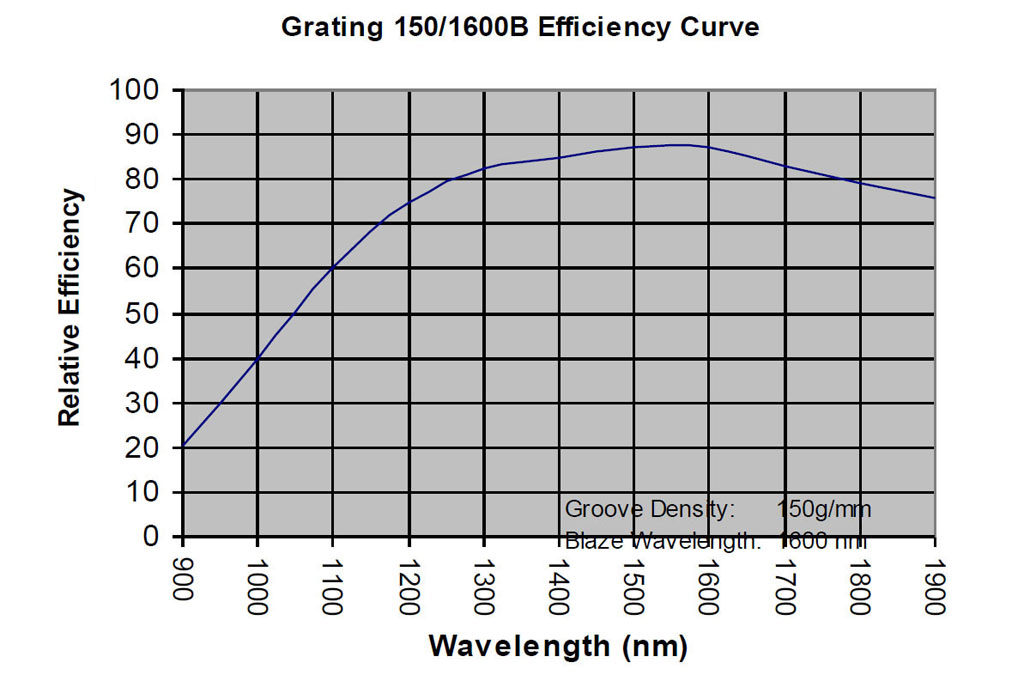
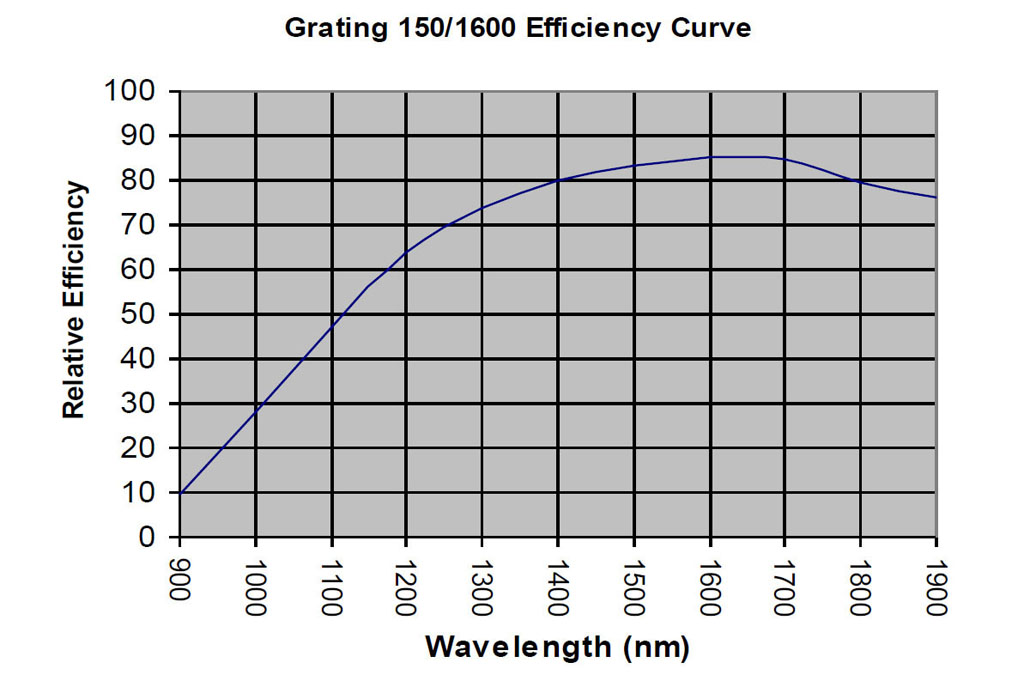
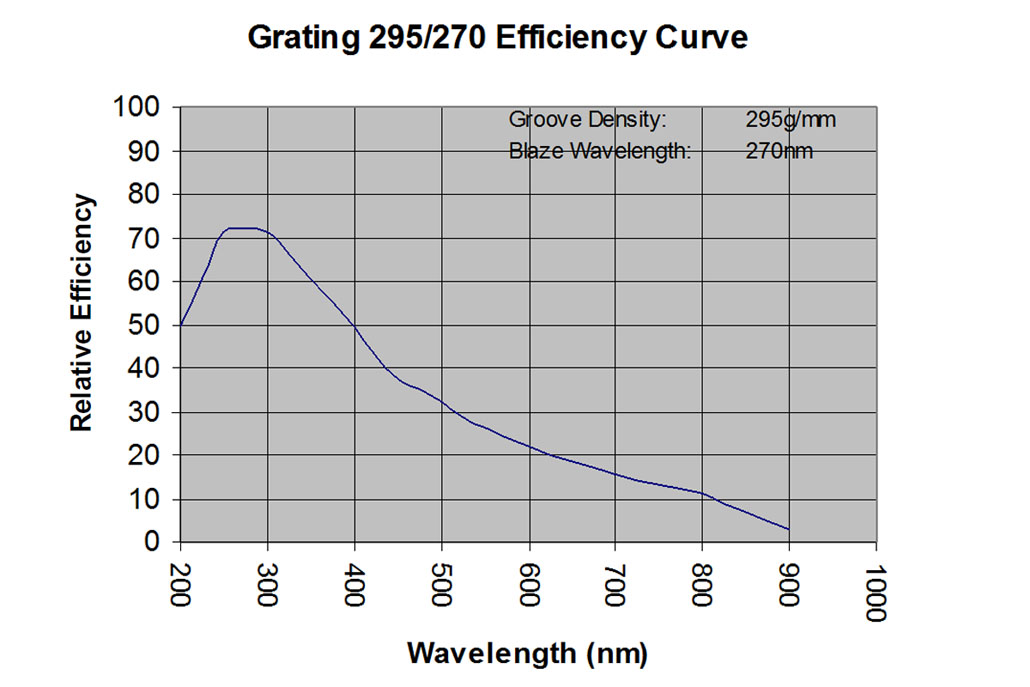
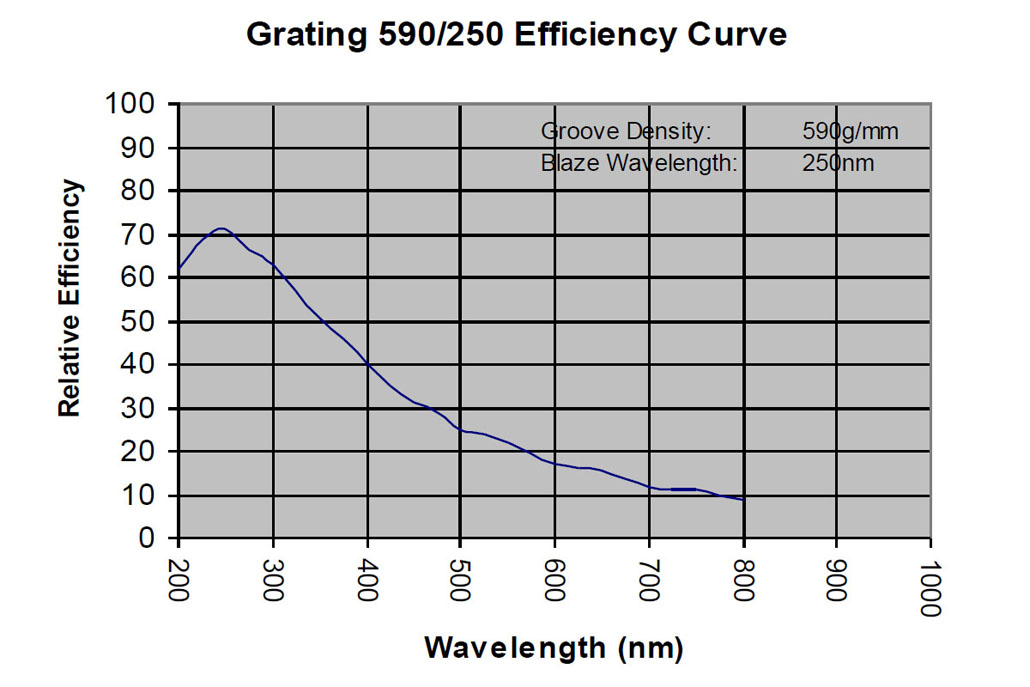
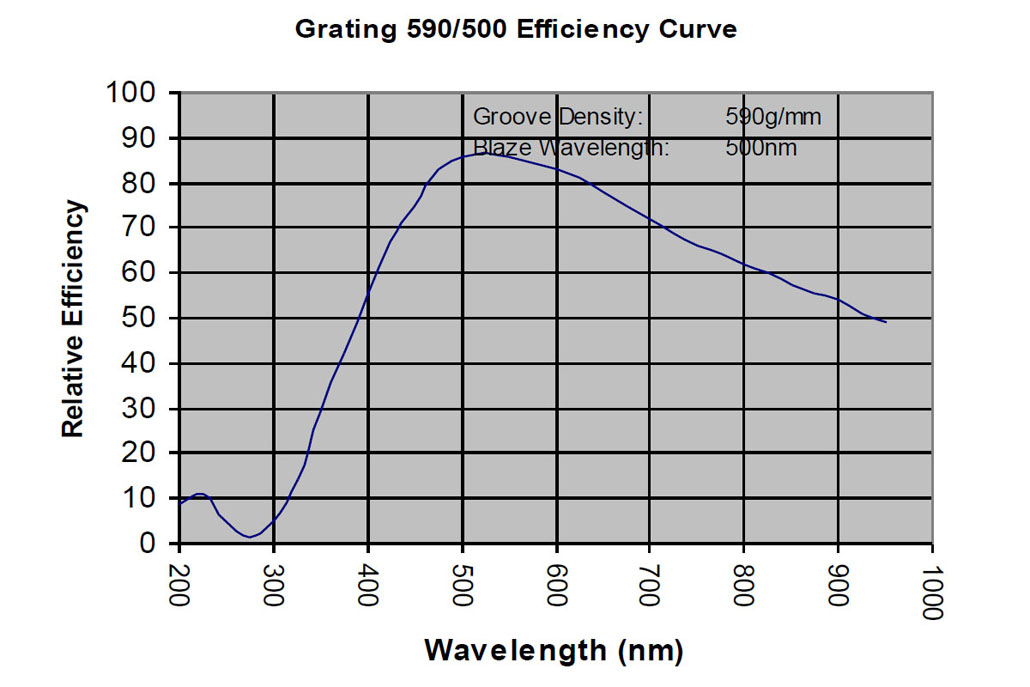
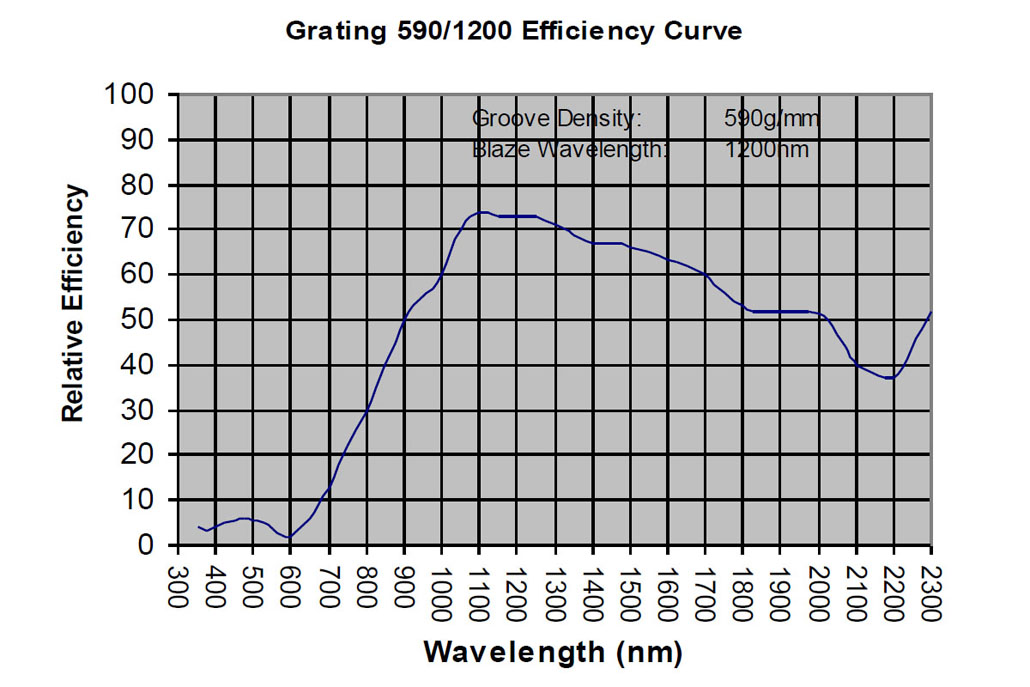
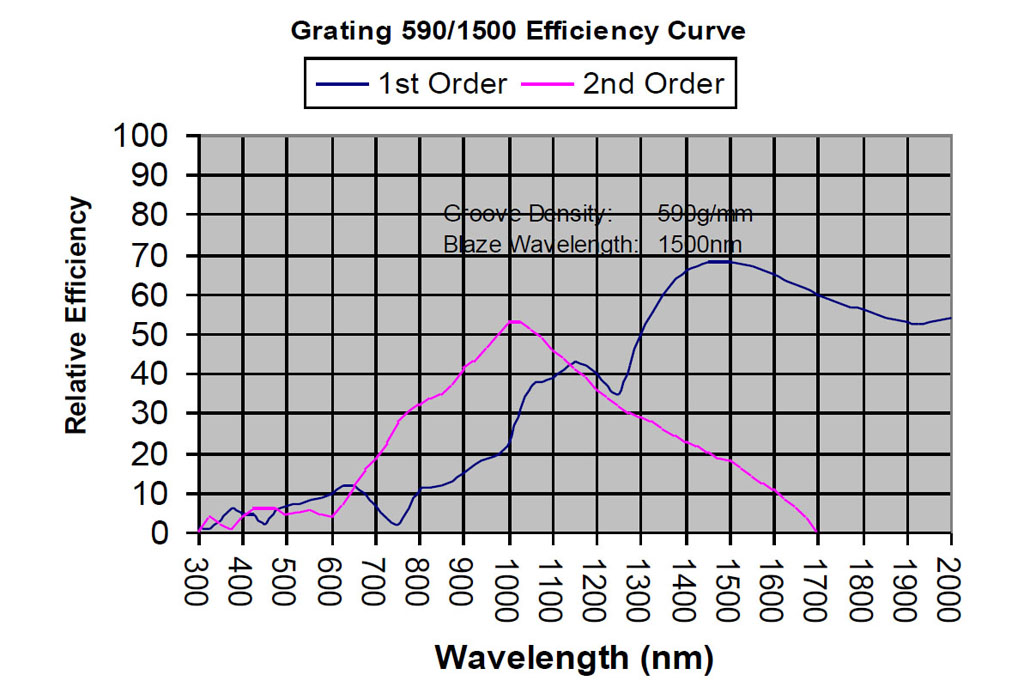
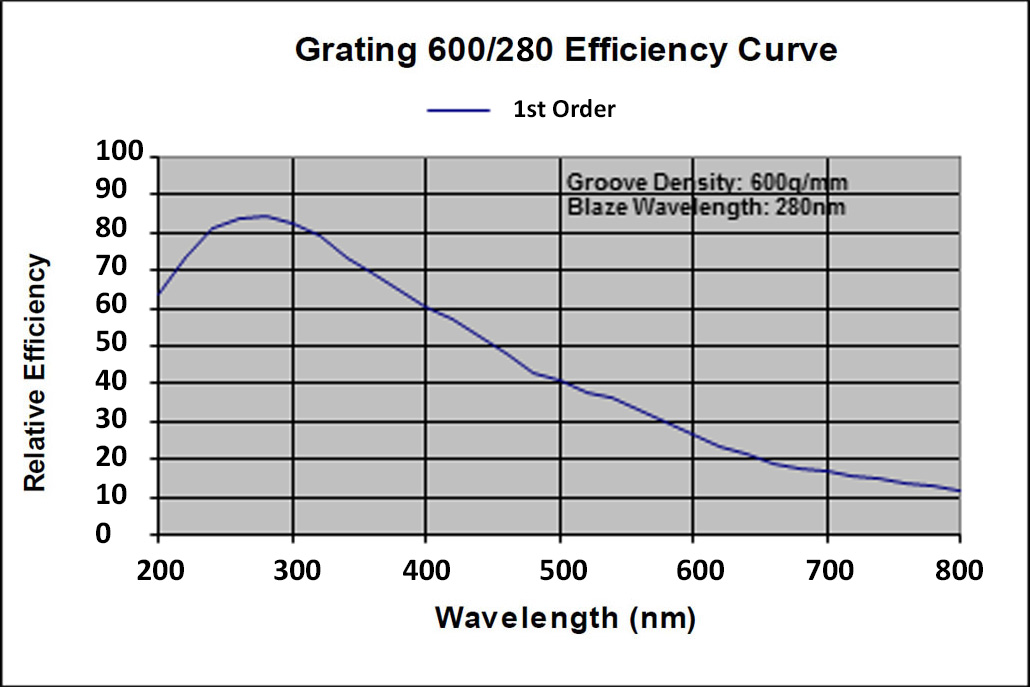
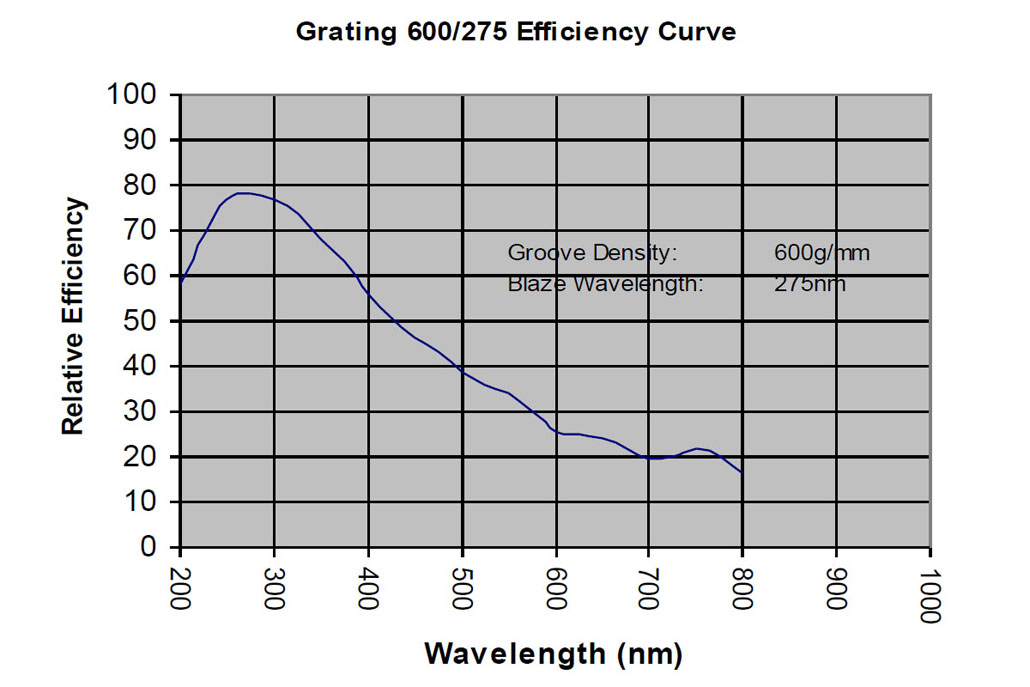
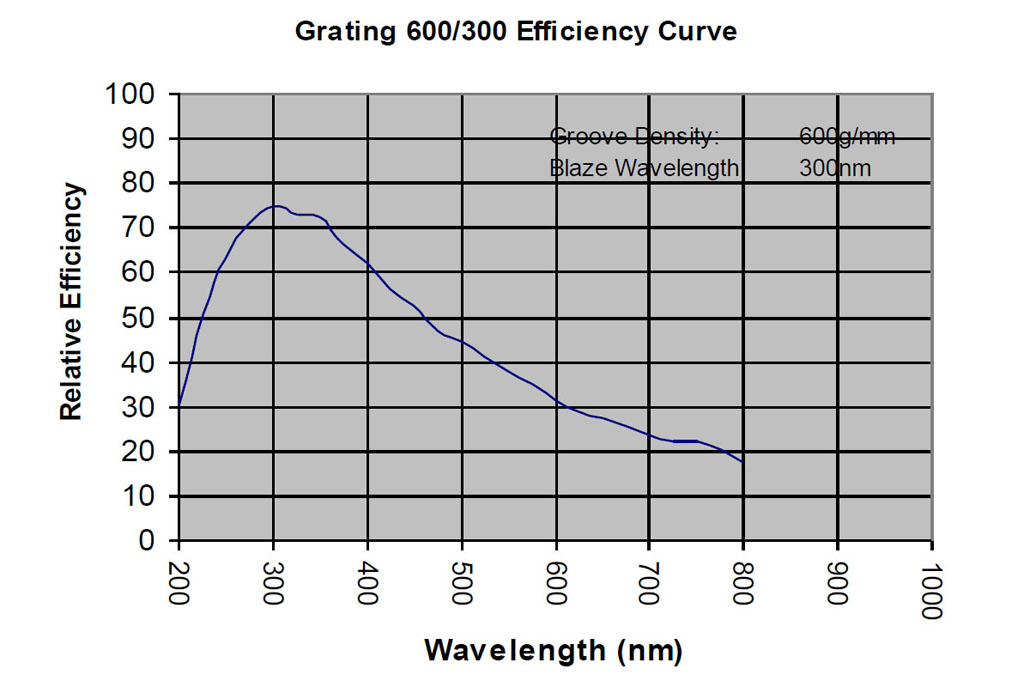
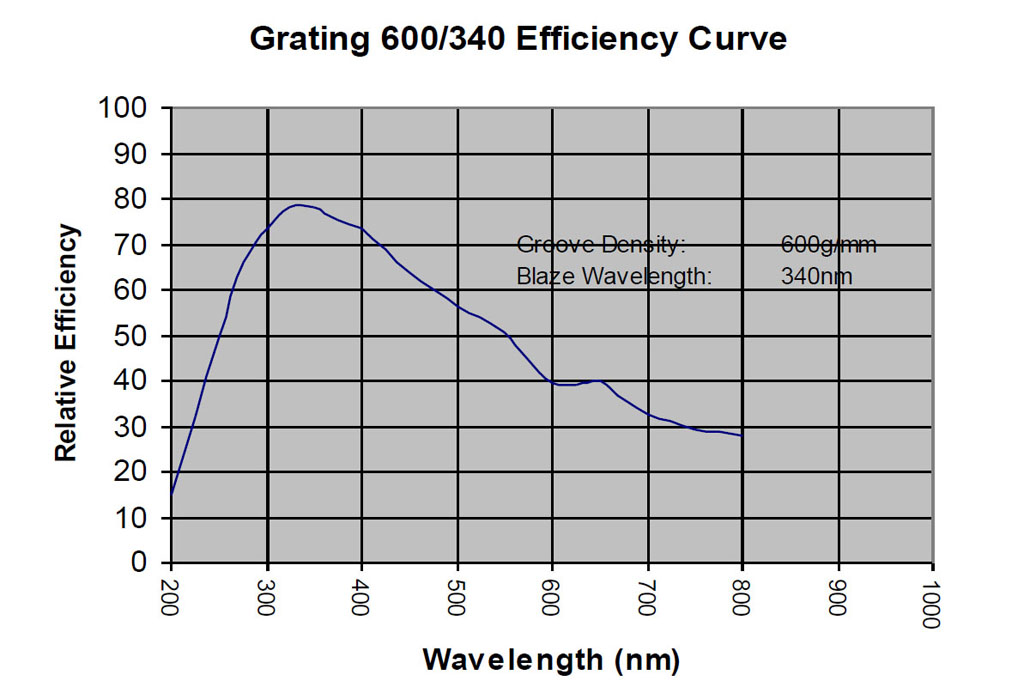
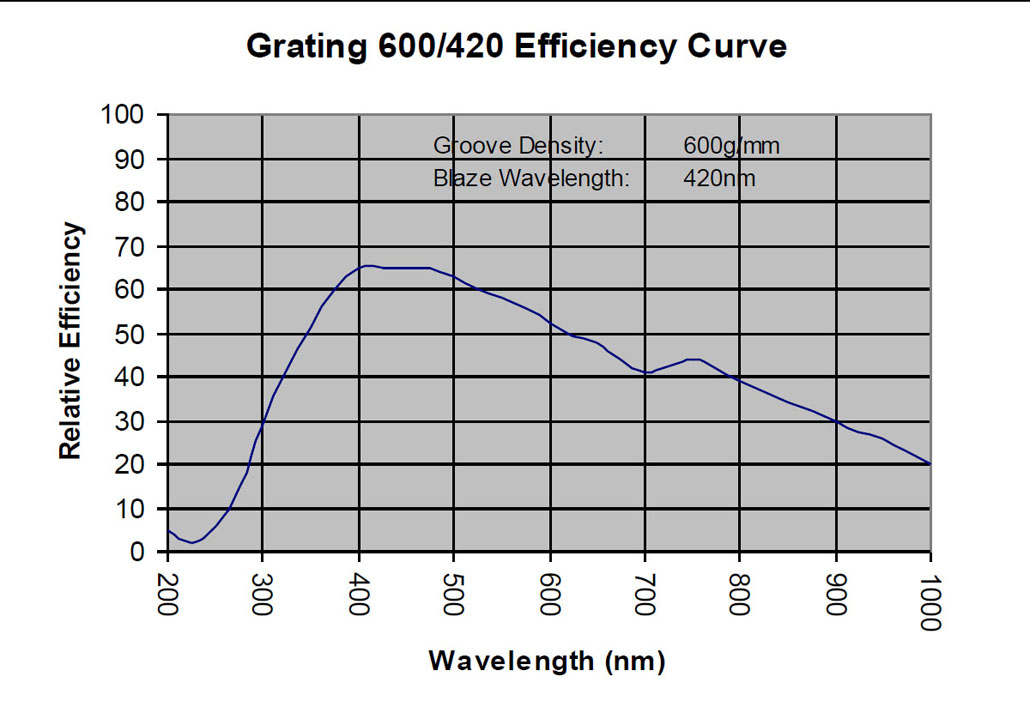
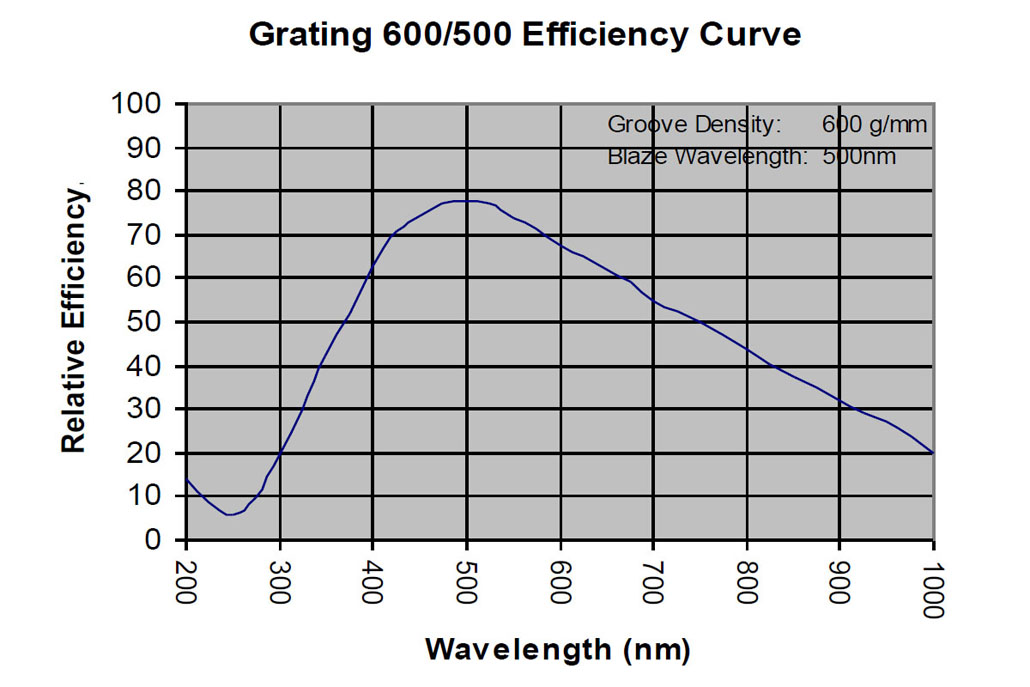
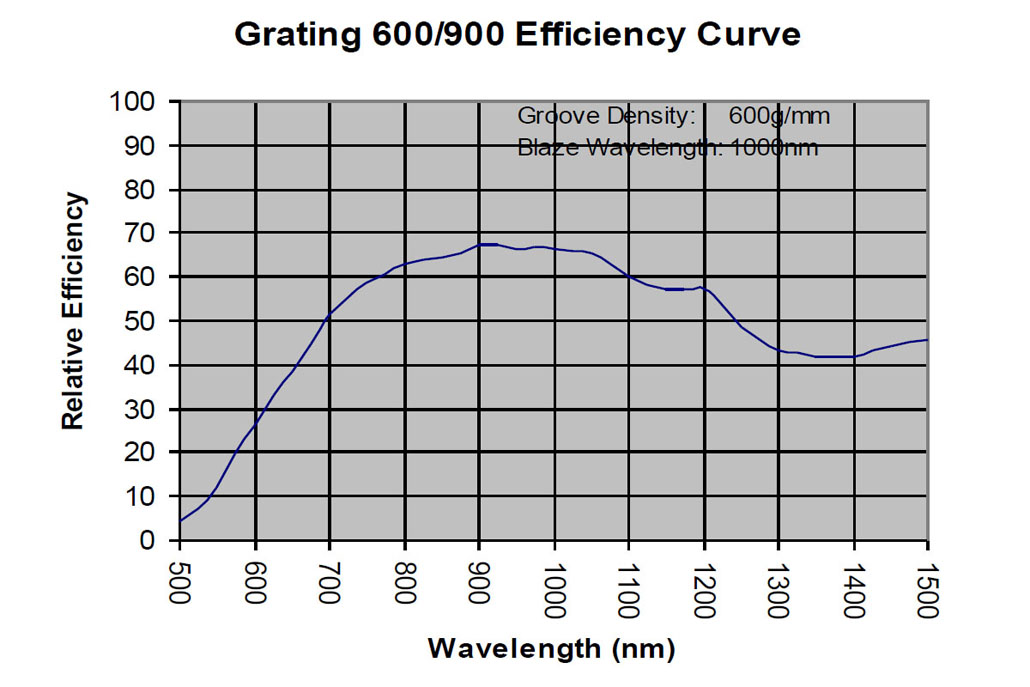
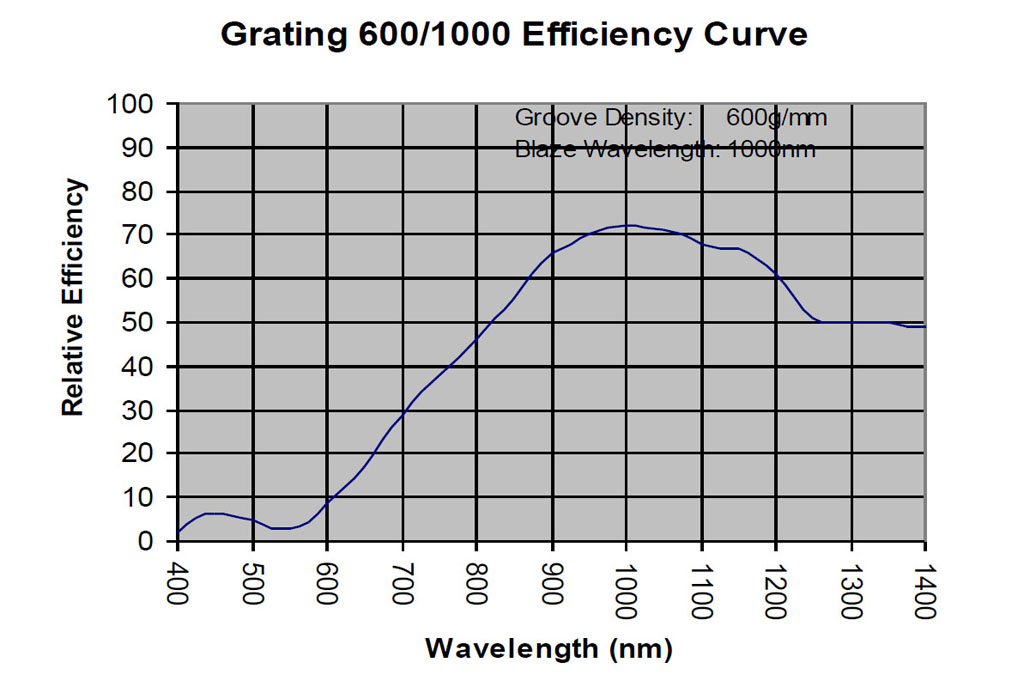
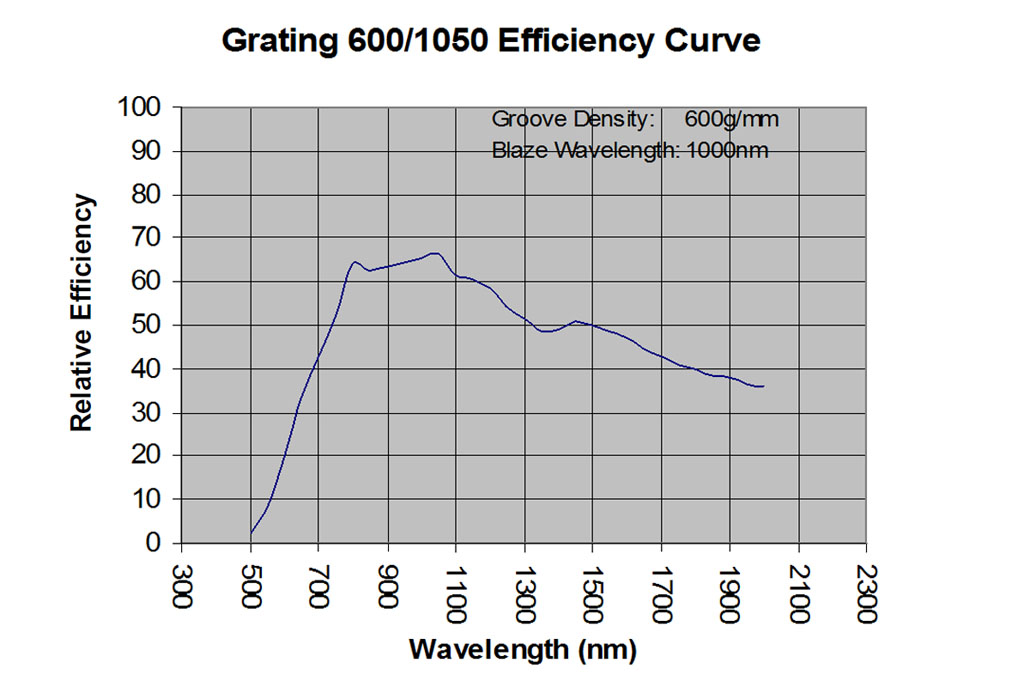
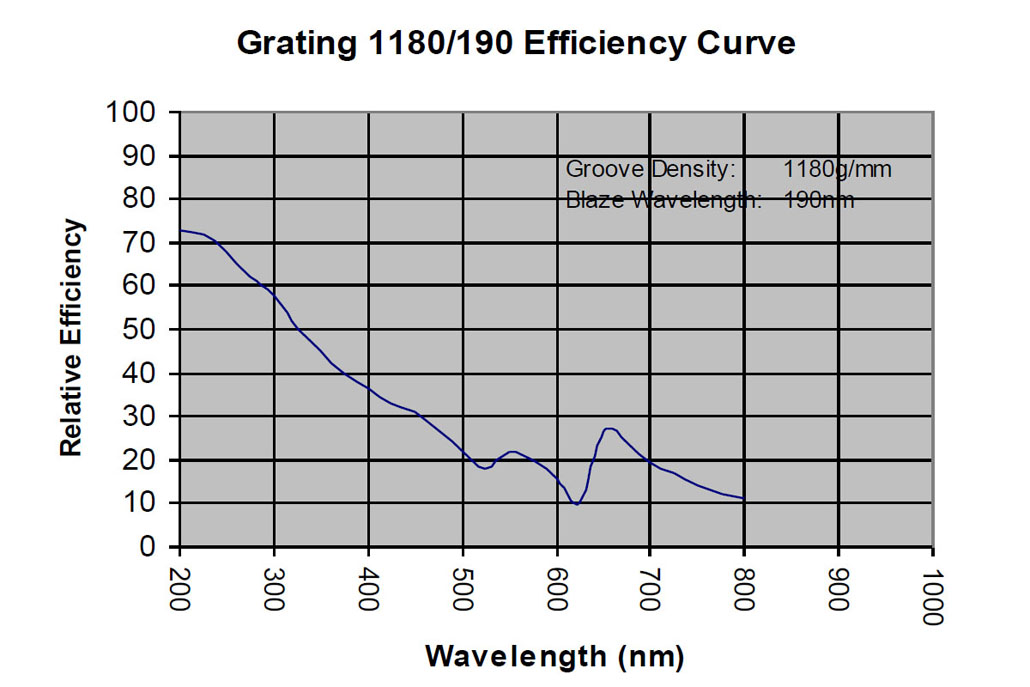
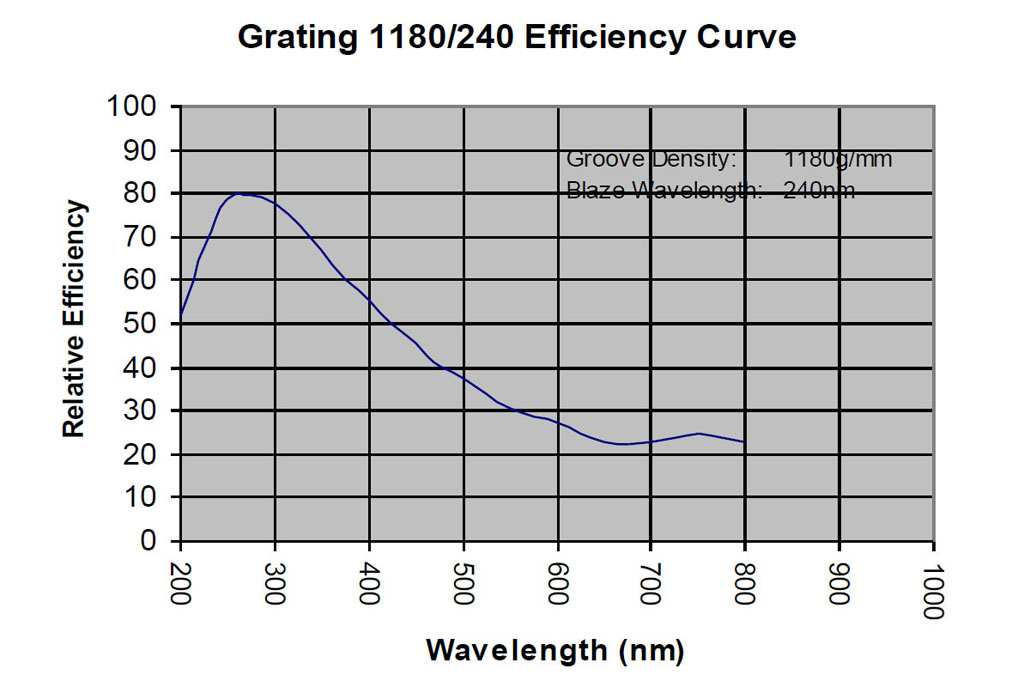
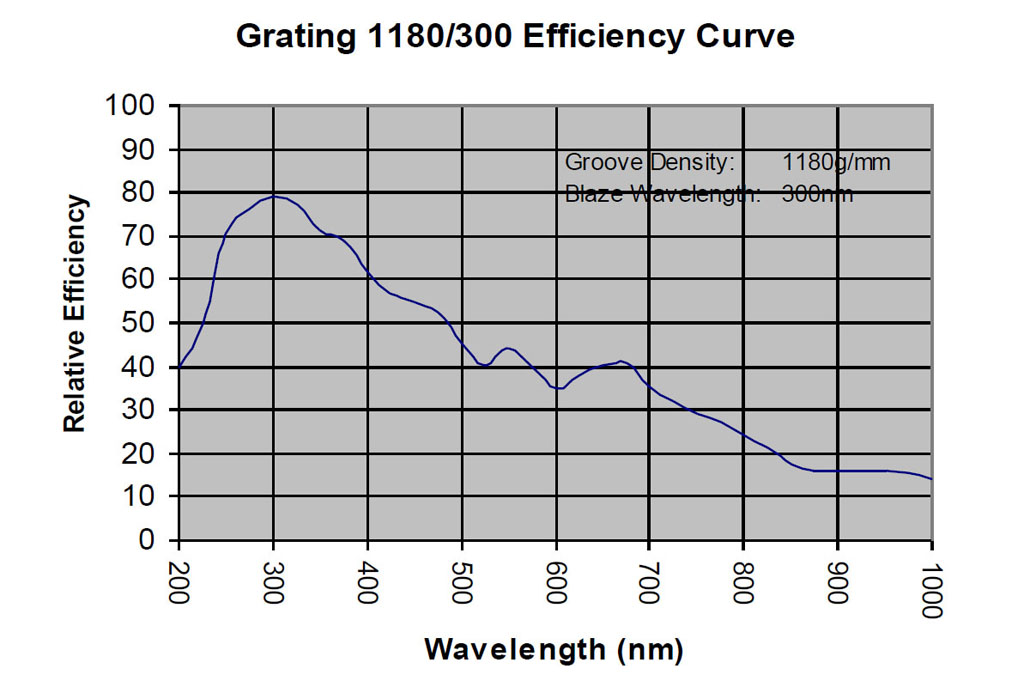
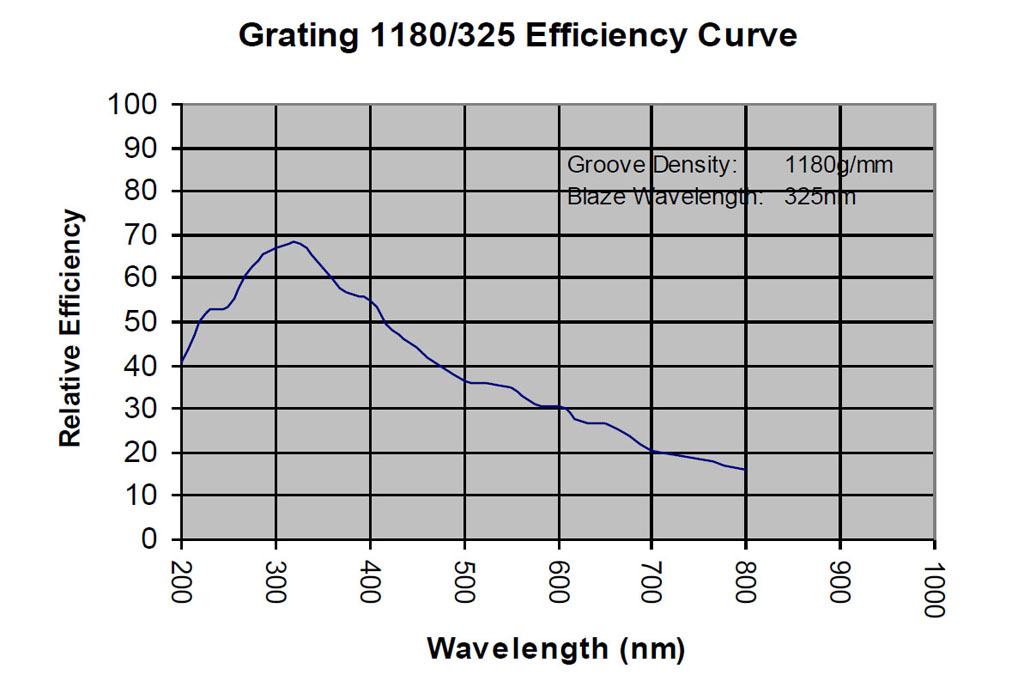
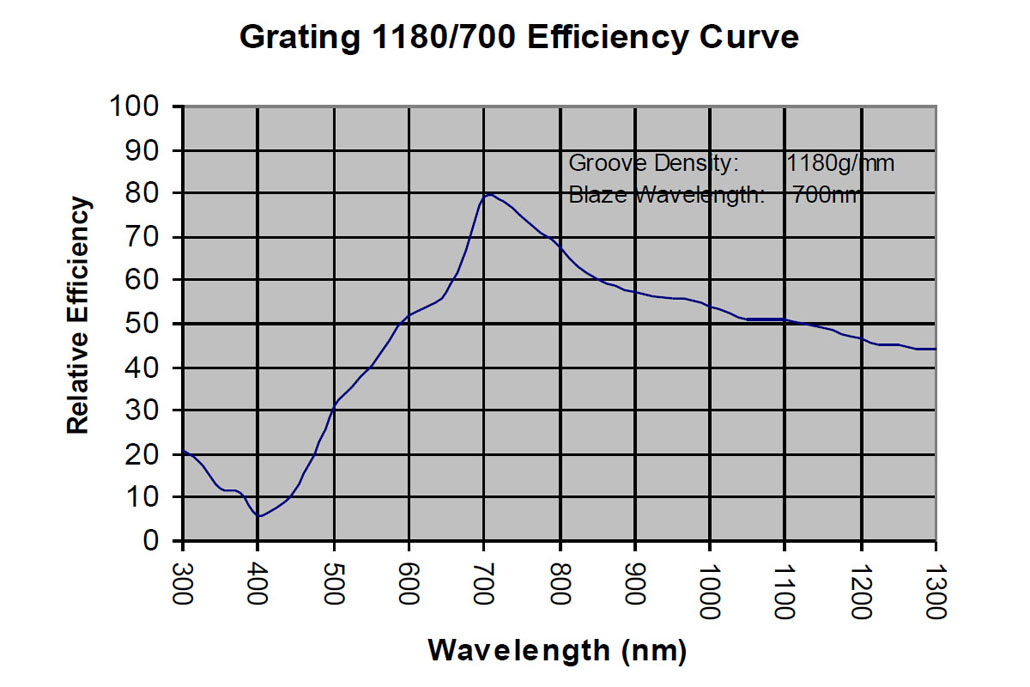
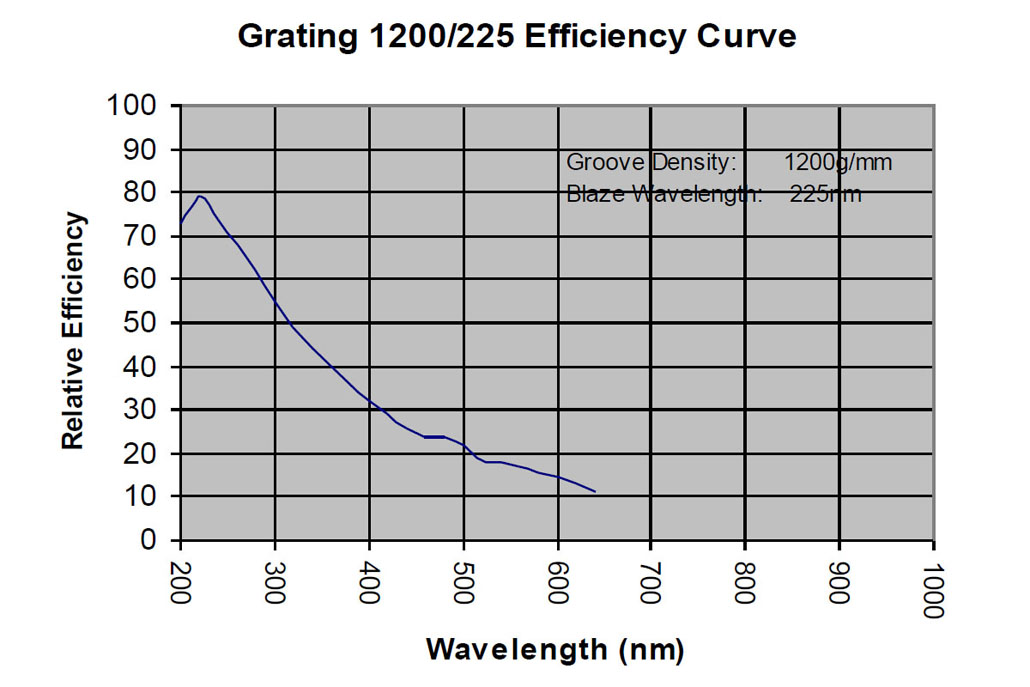
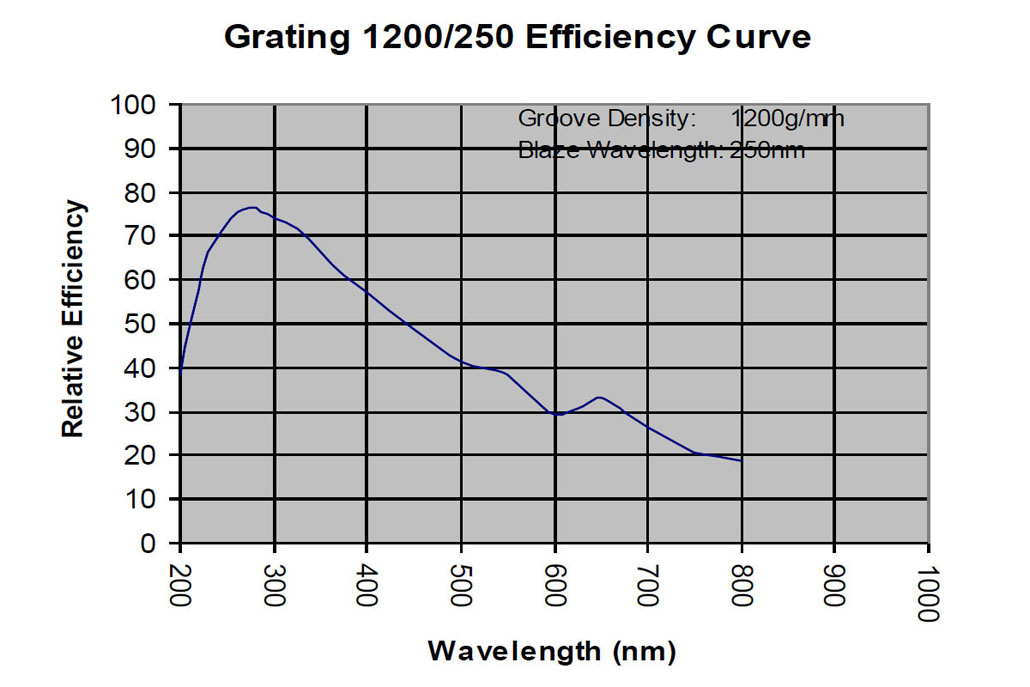
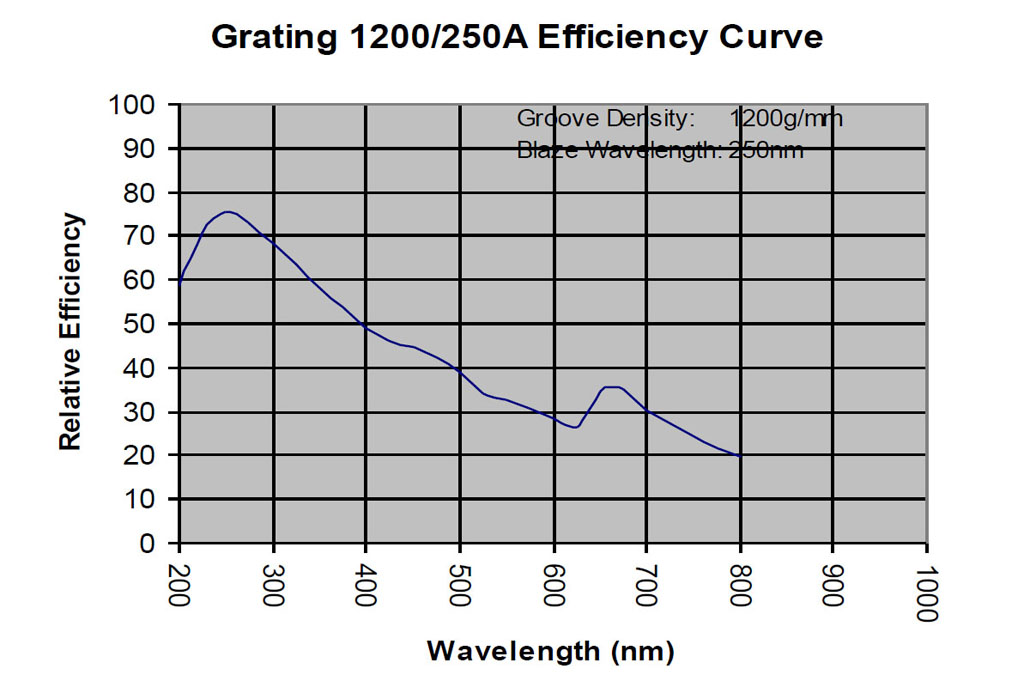
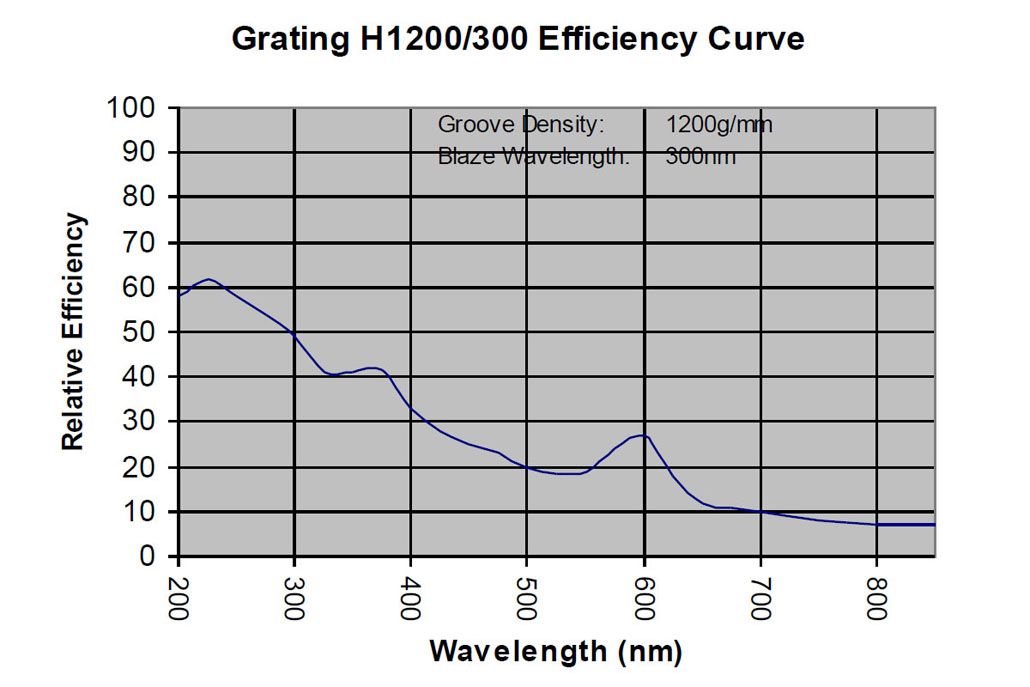
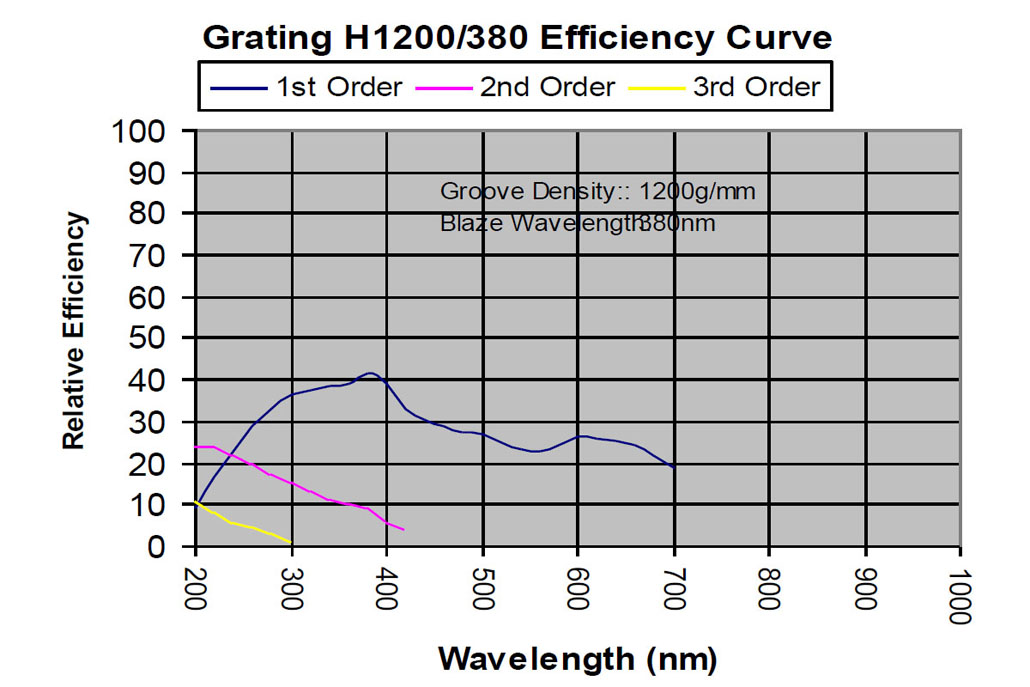
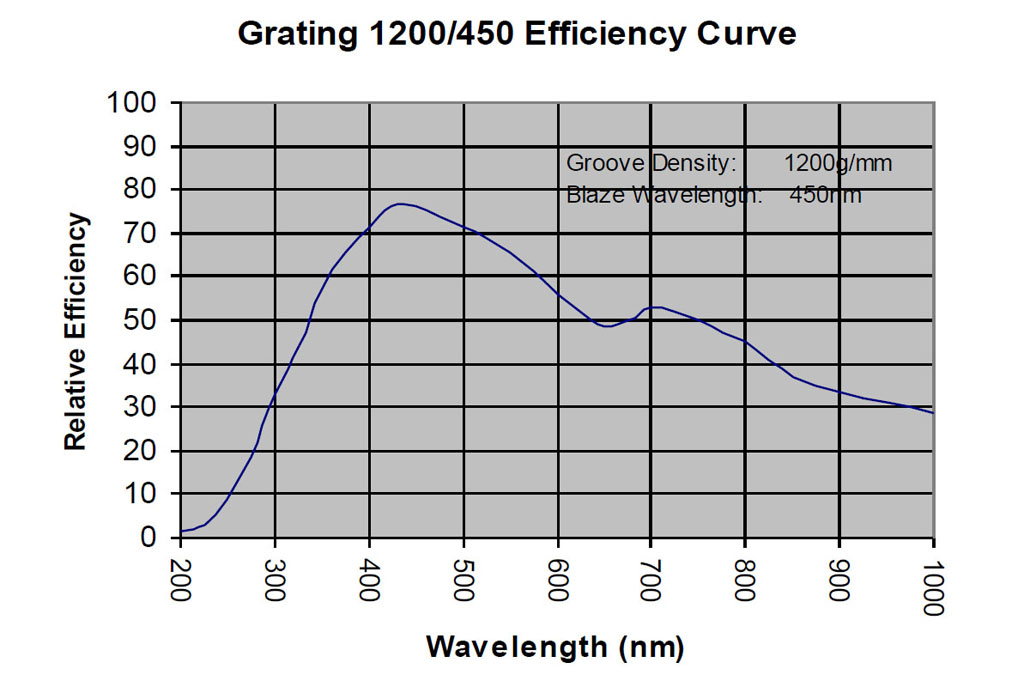
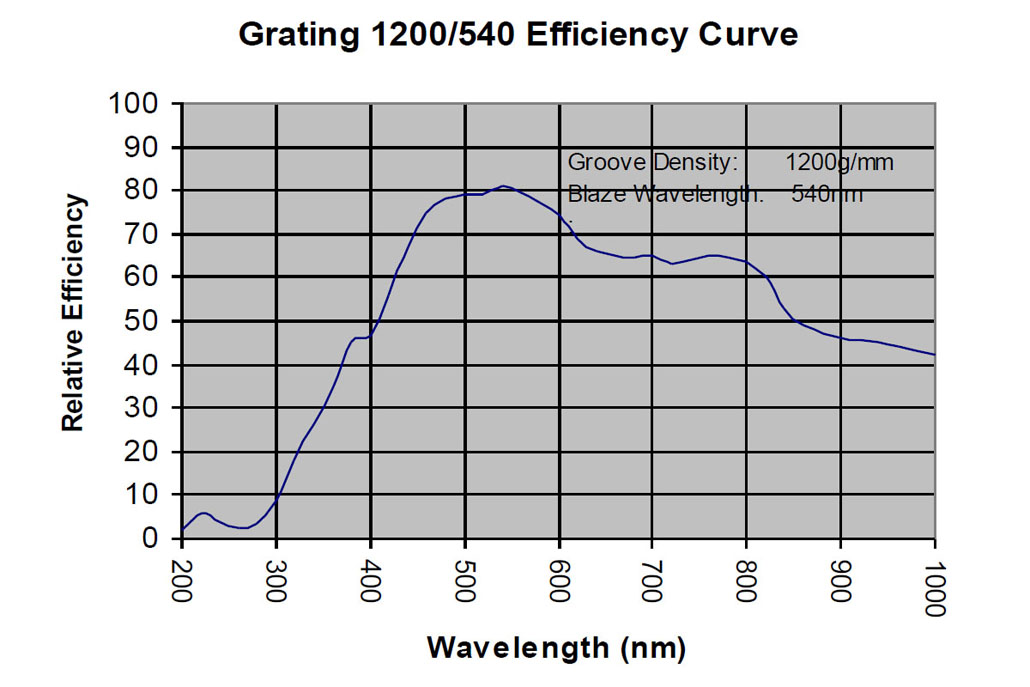
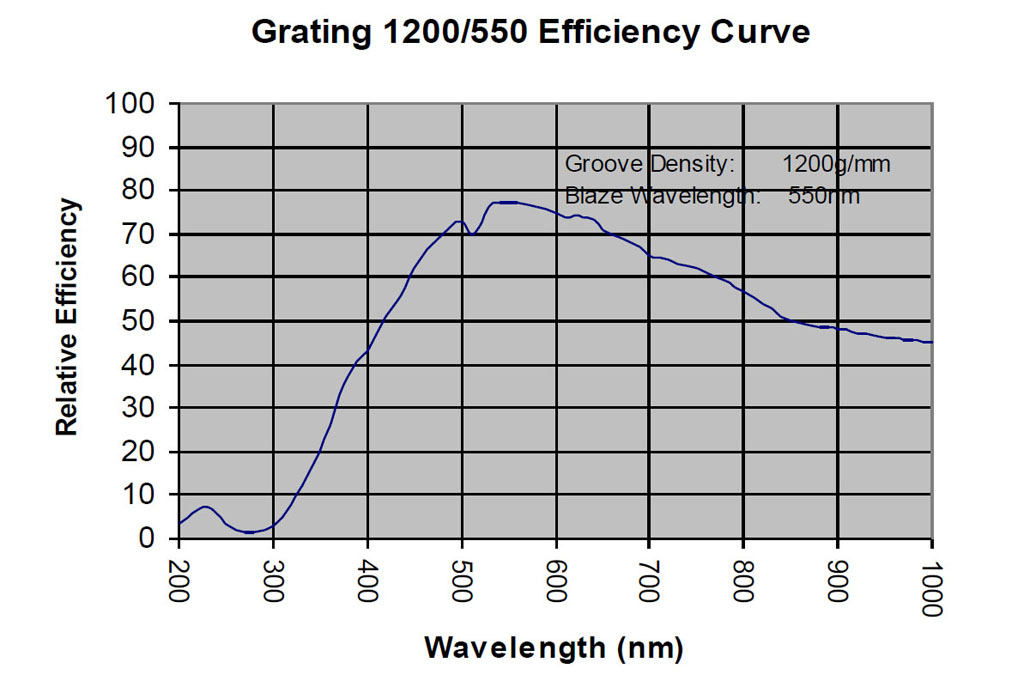
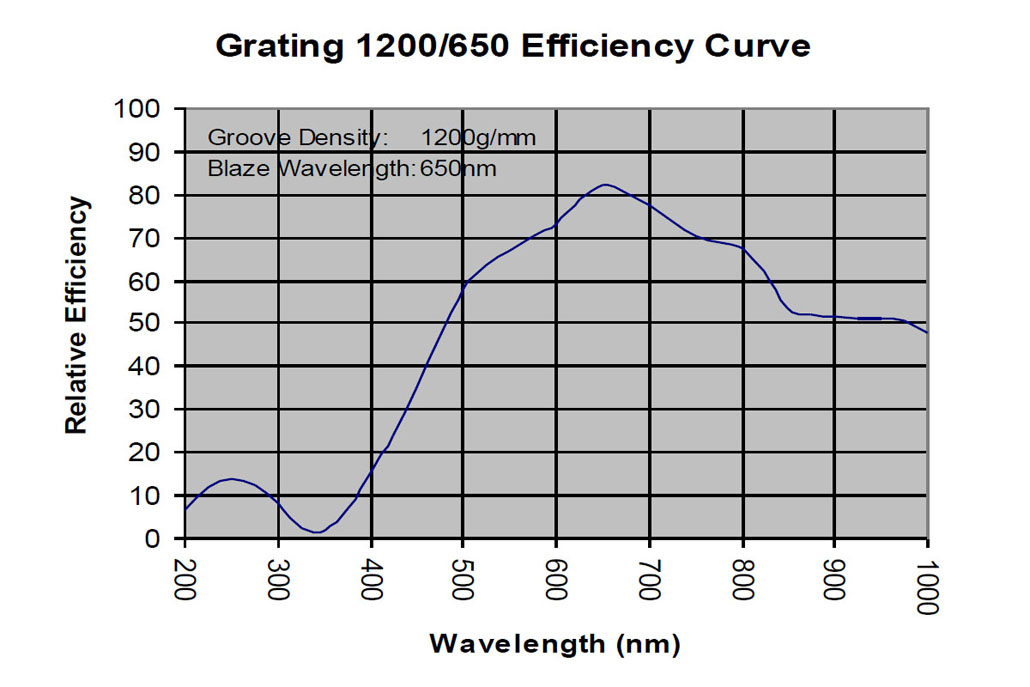
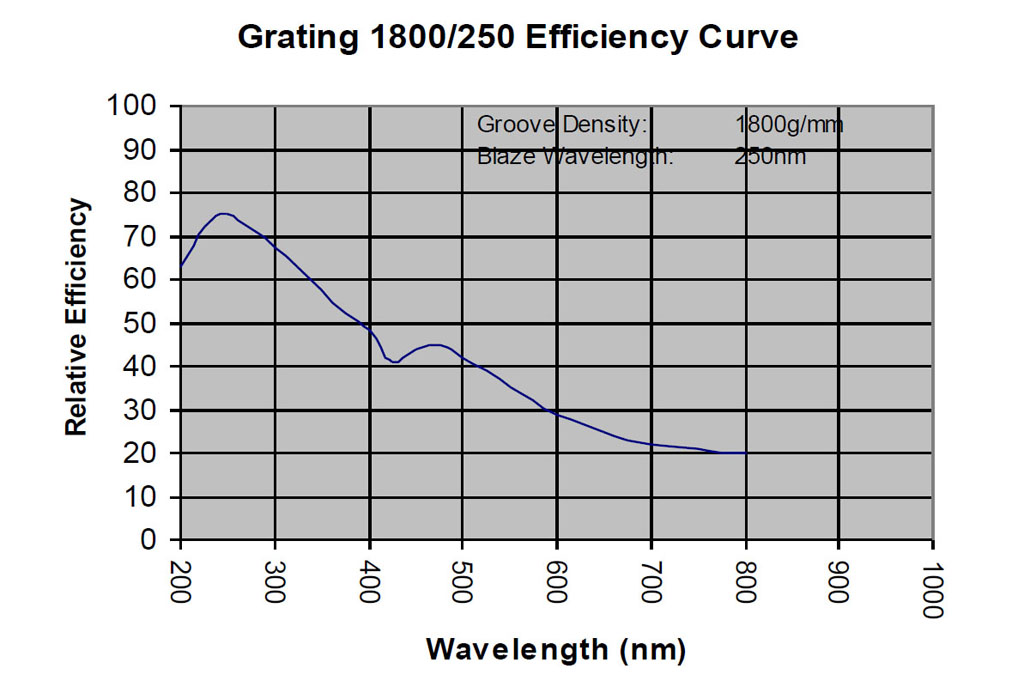
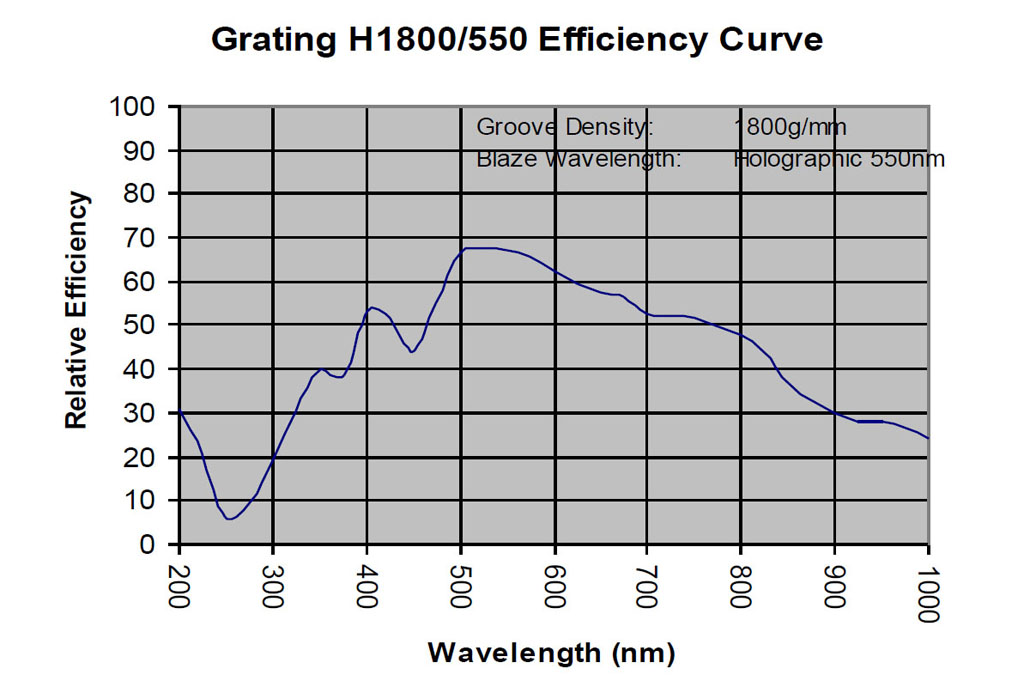
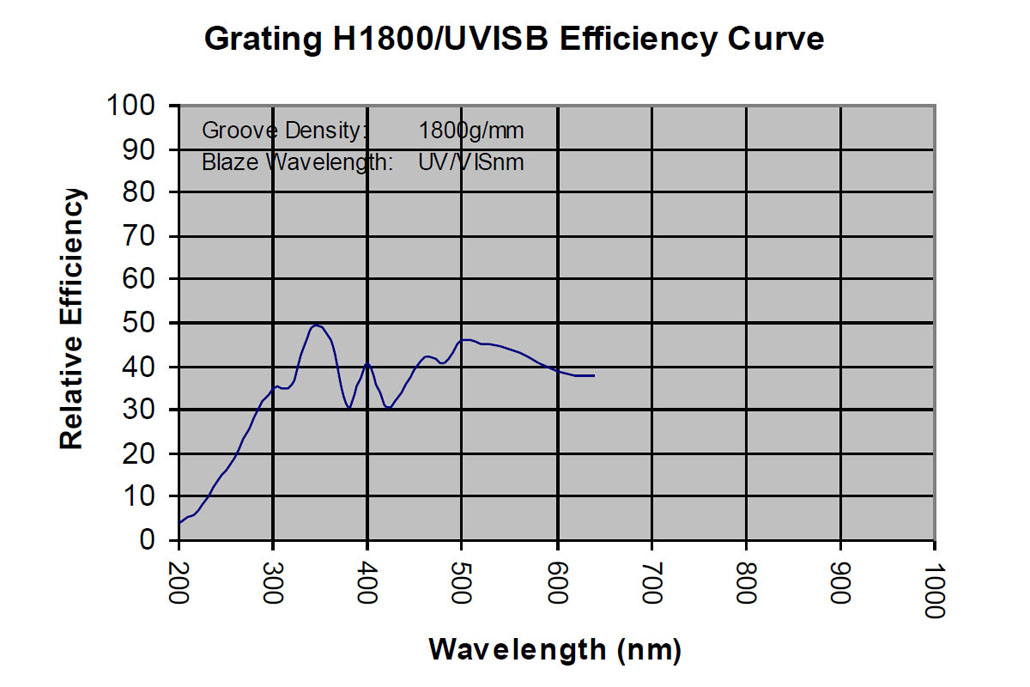
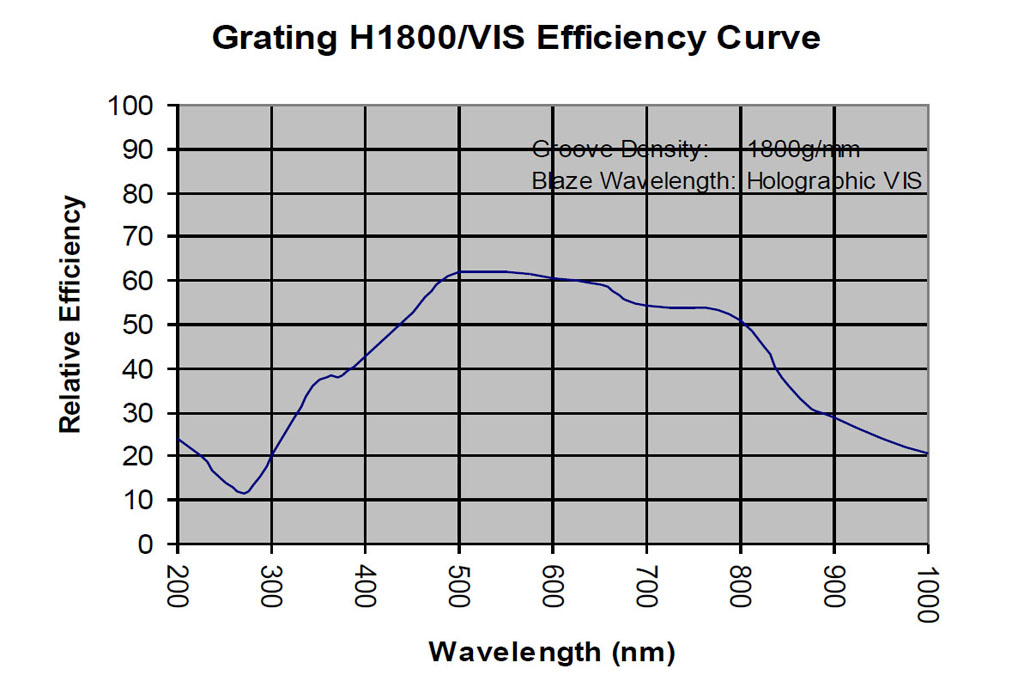
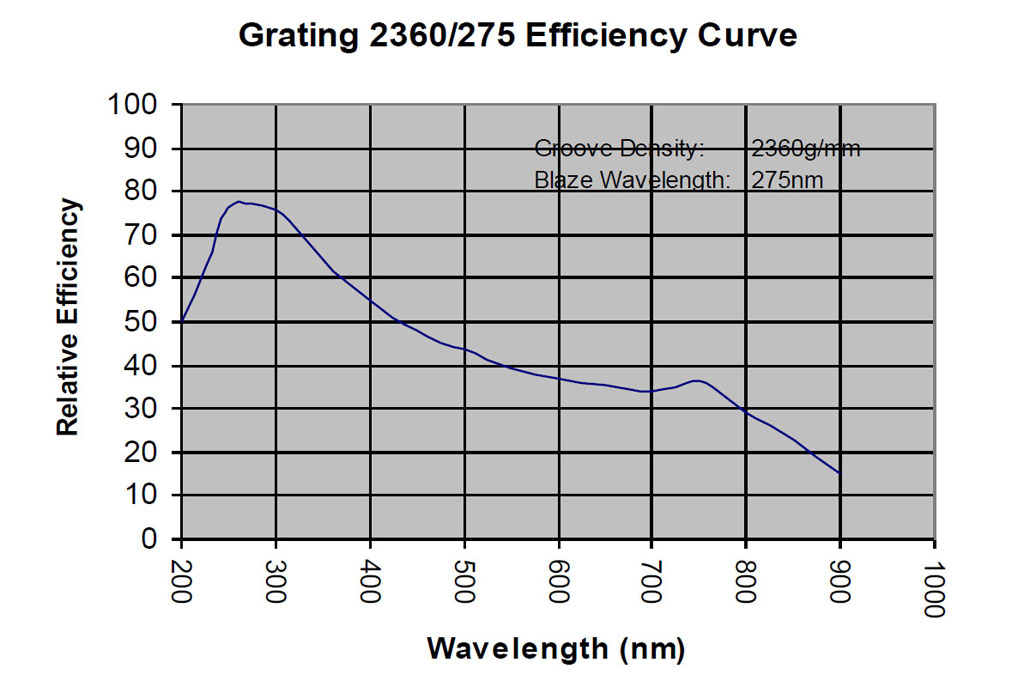
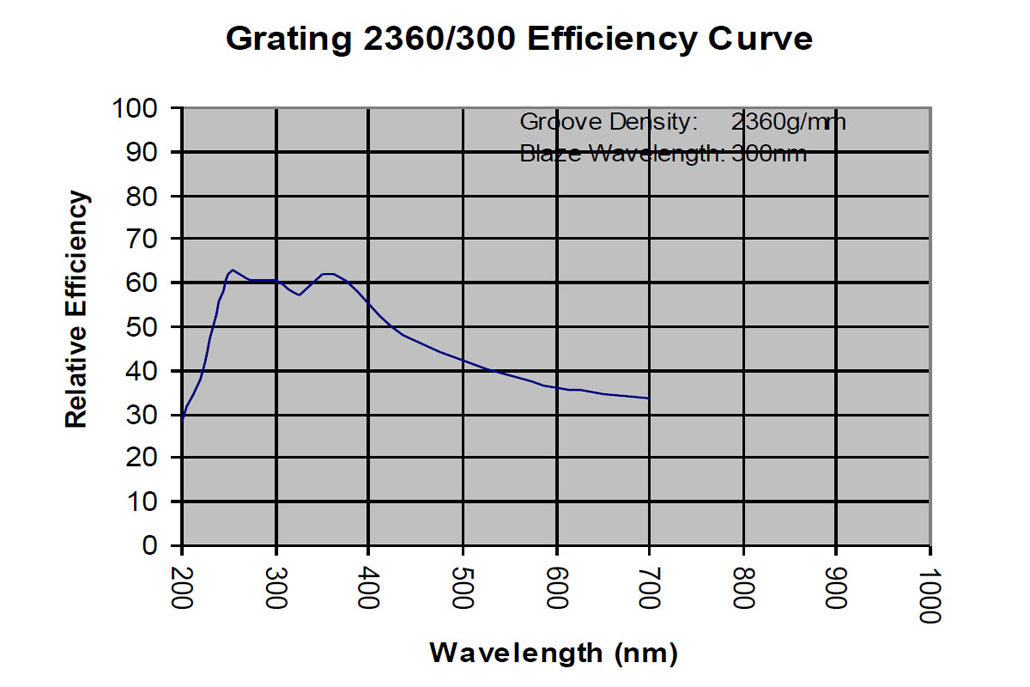
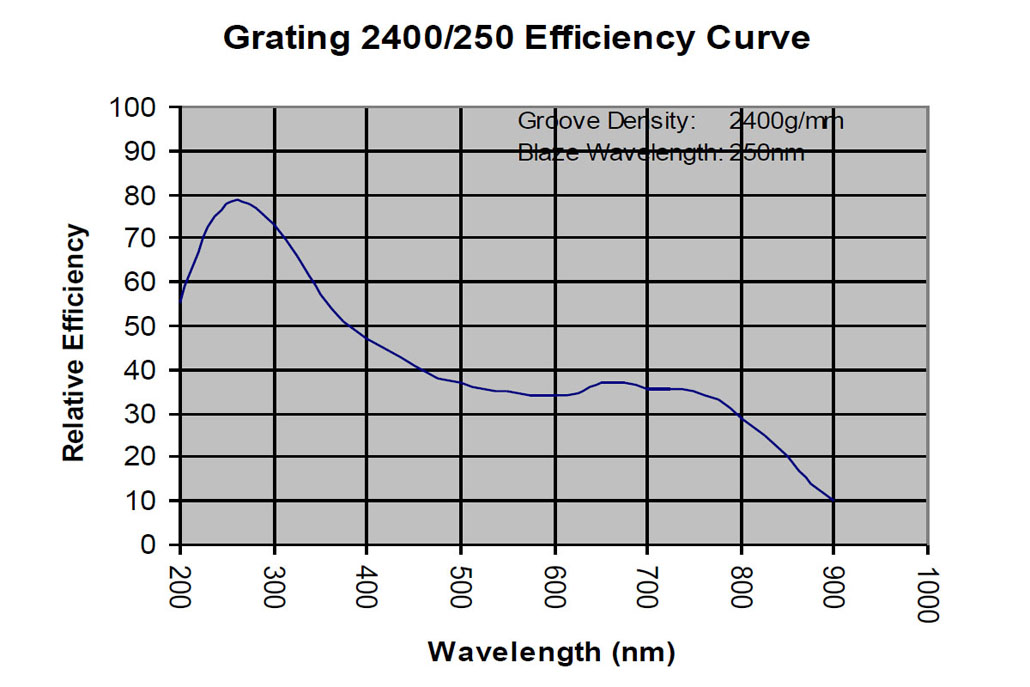
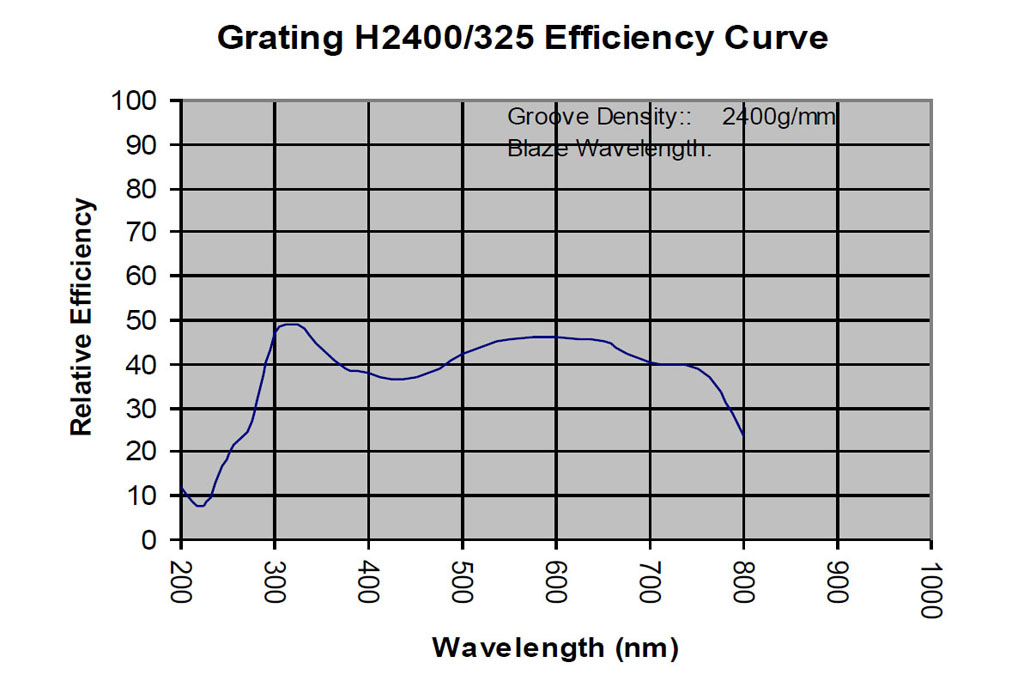
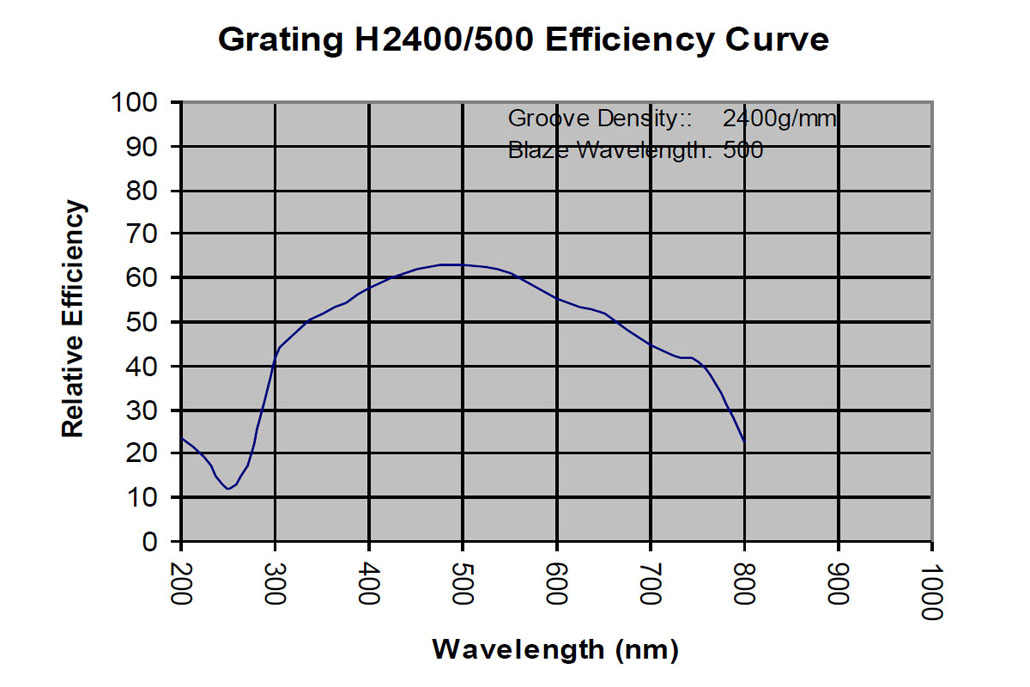
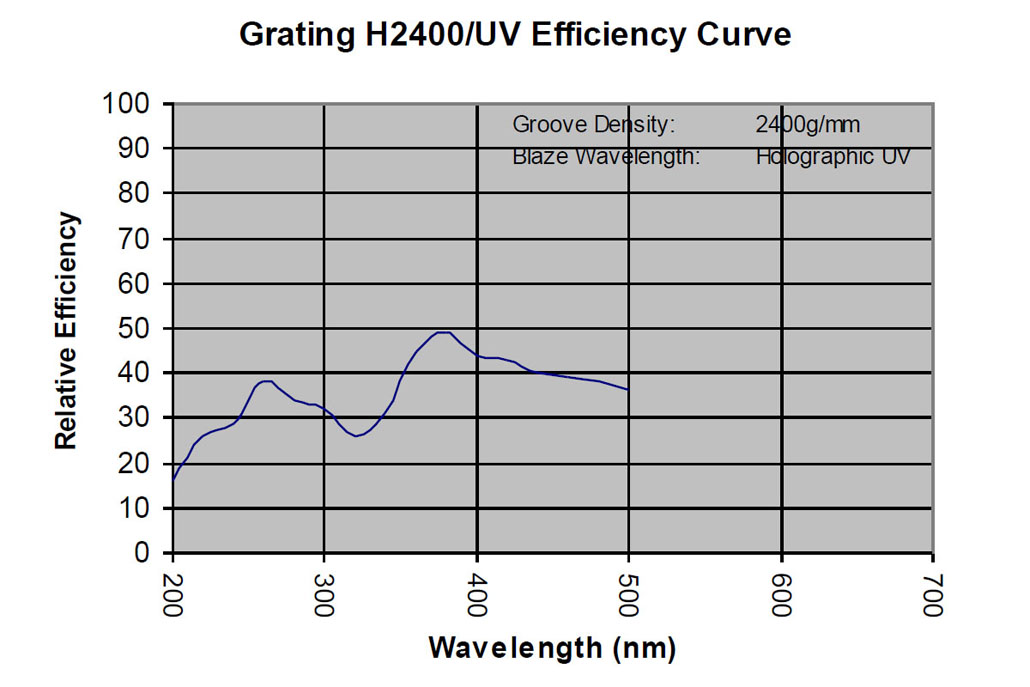
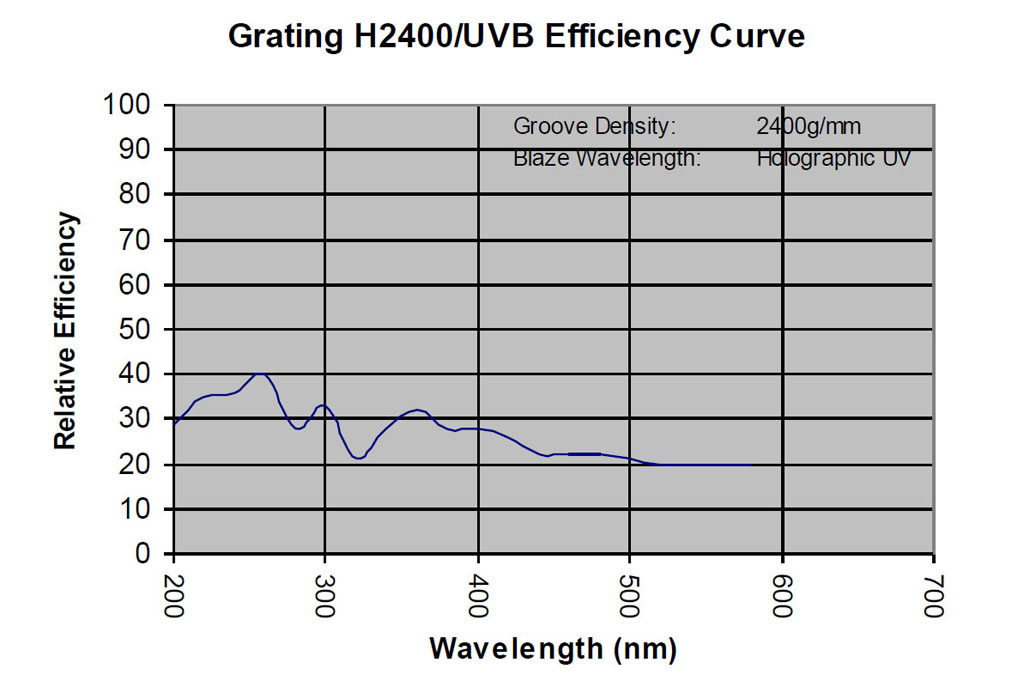
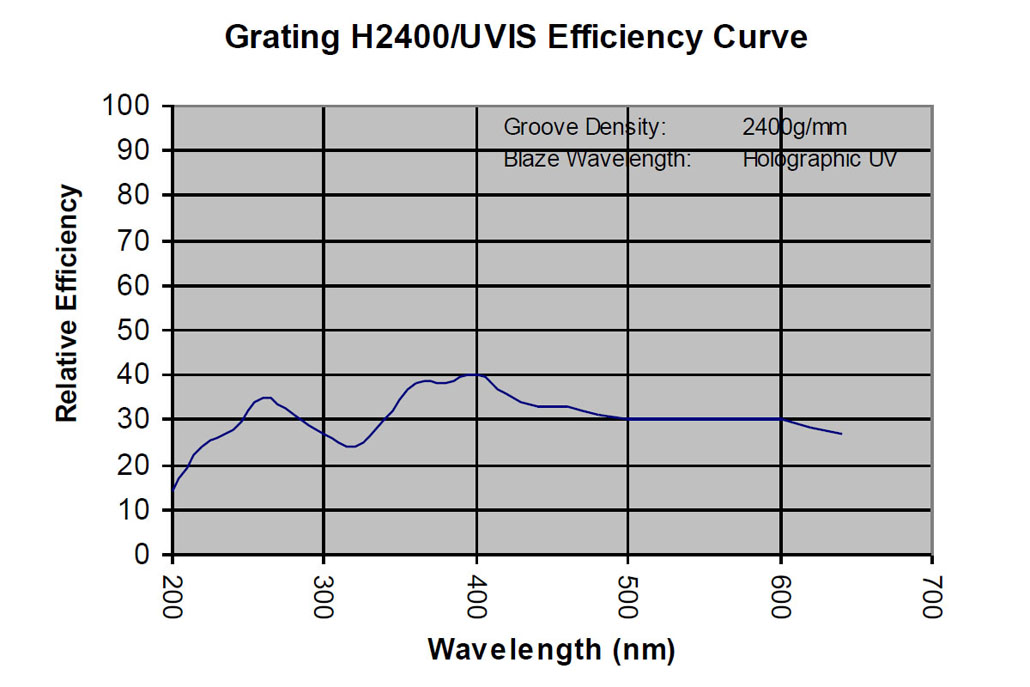
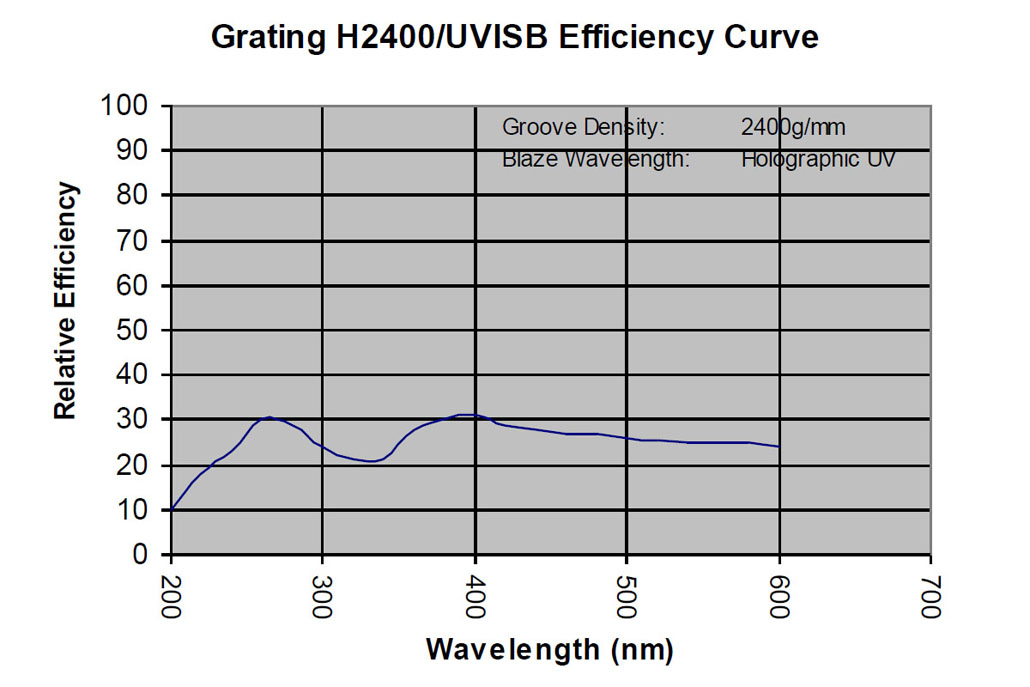
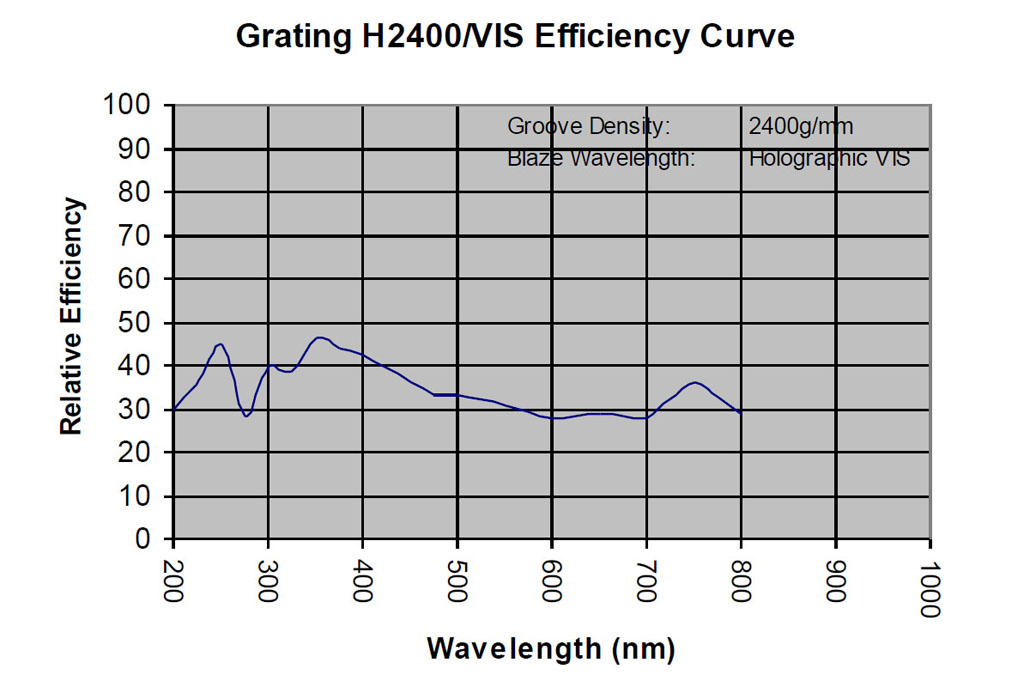
Groove Density and Blaze Wavelength
Groove density is the measurement of the internal angles between the zeroth-order and first-order diffraction gratings for two distinct wavelengths with the same incidence angles.
Blaze wavelength is the wavelength at which the diffraction efficiency curve achieves its maximum for a specific order. It is determined by the shape of the grating and reveals its overall effectiveness.
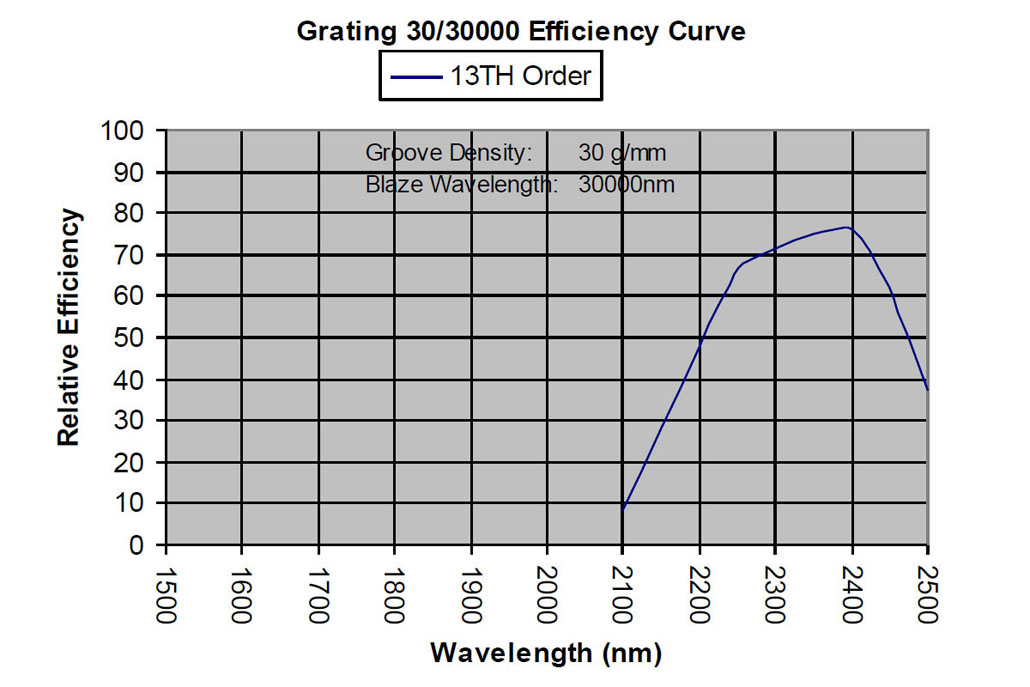
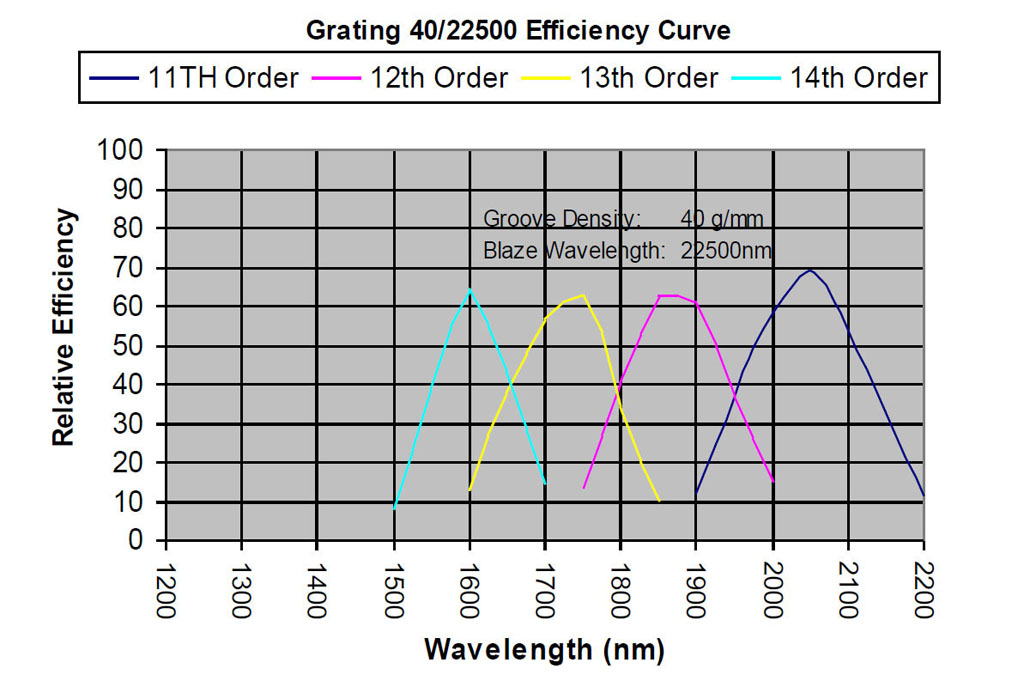
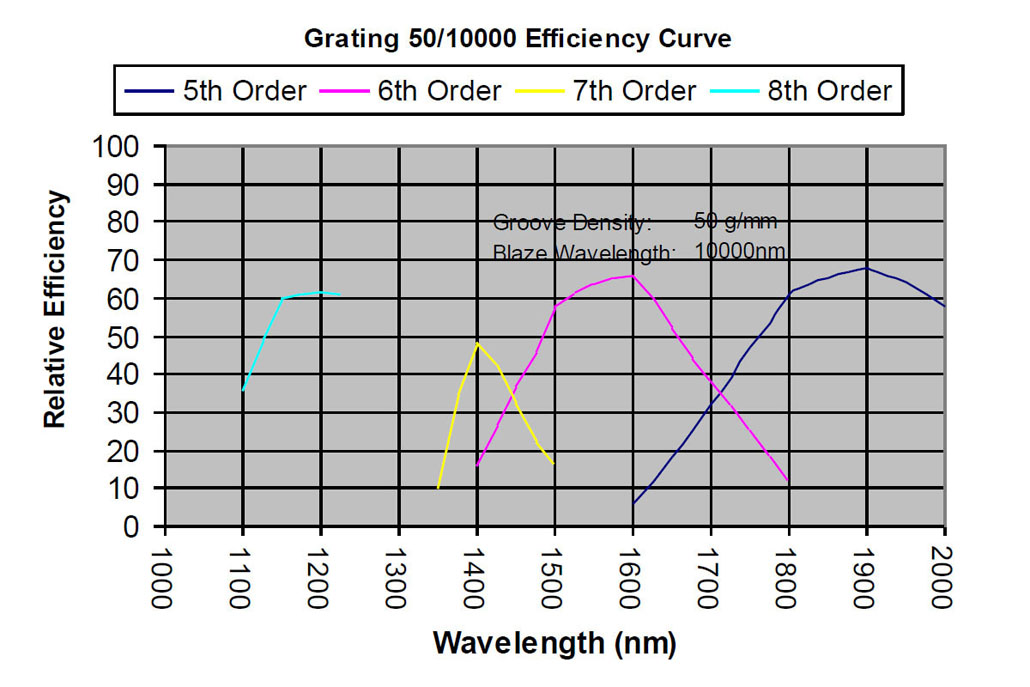
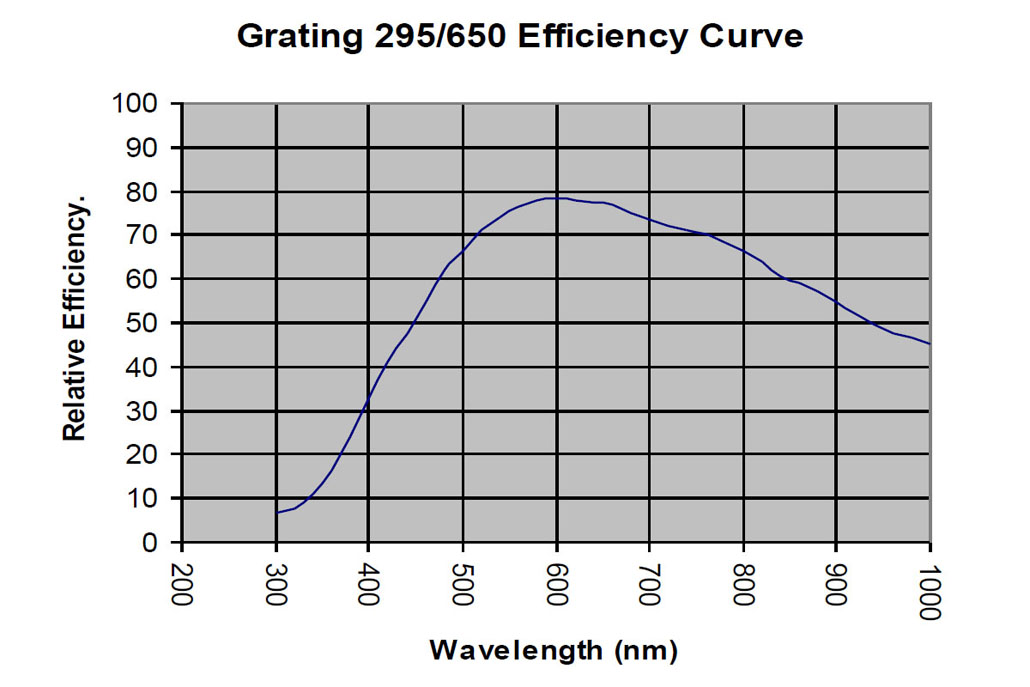
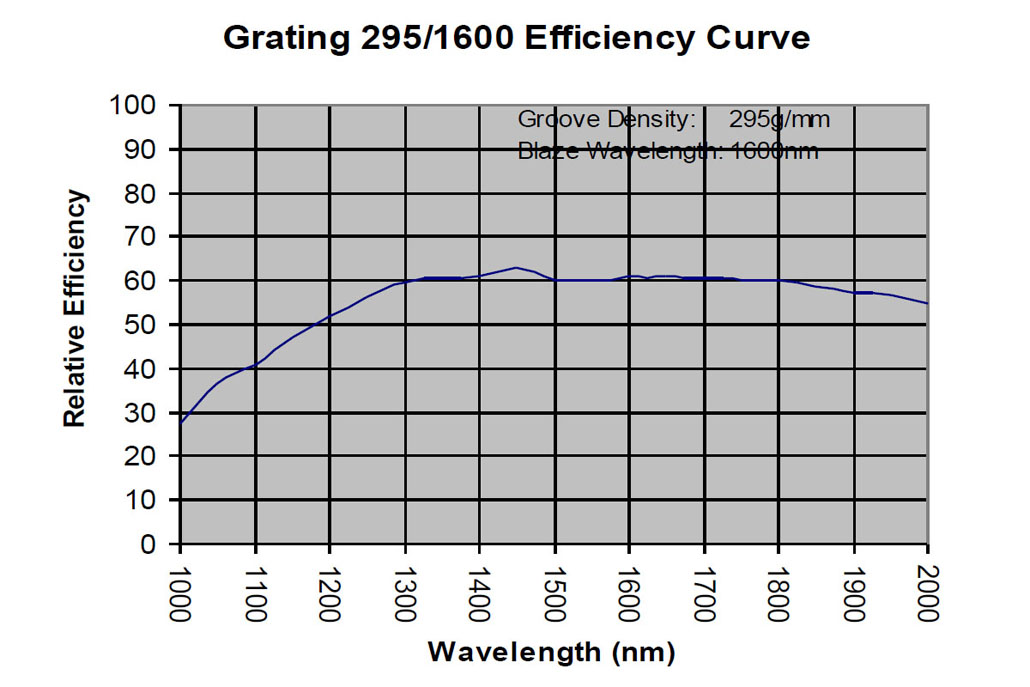
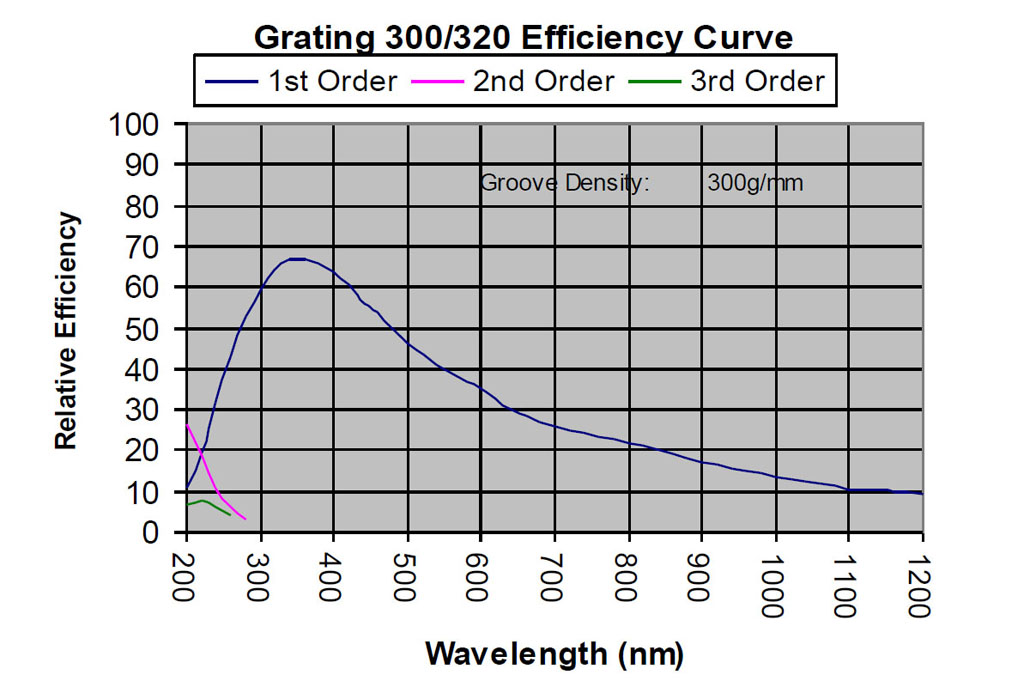
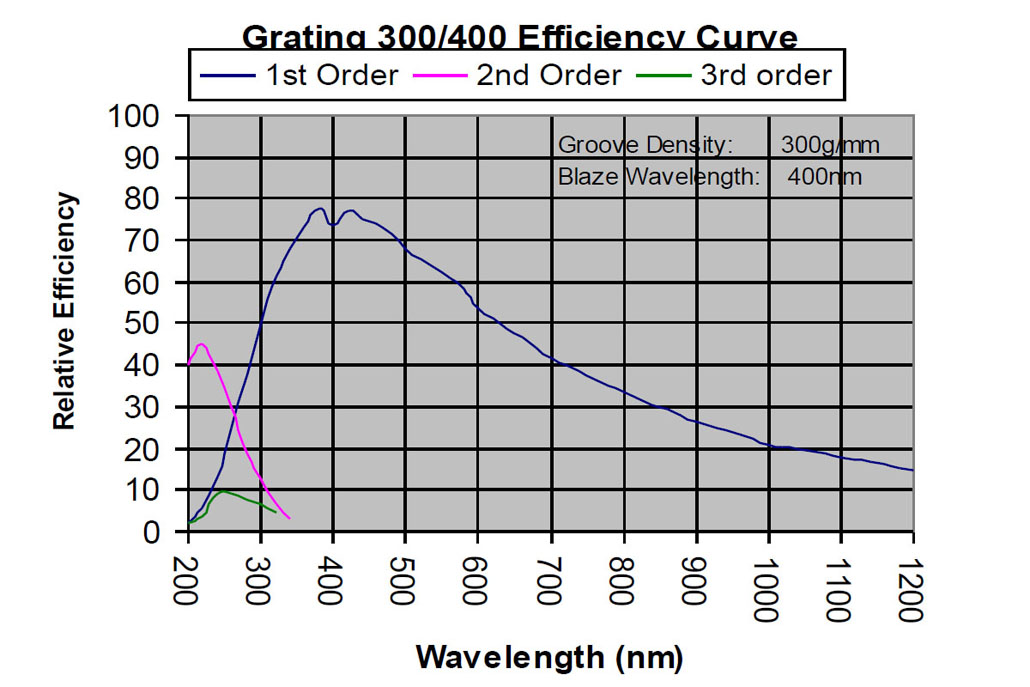
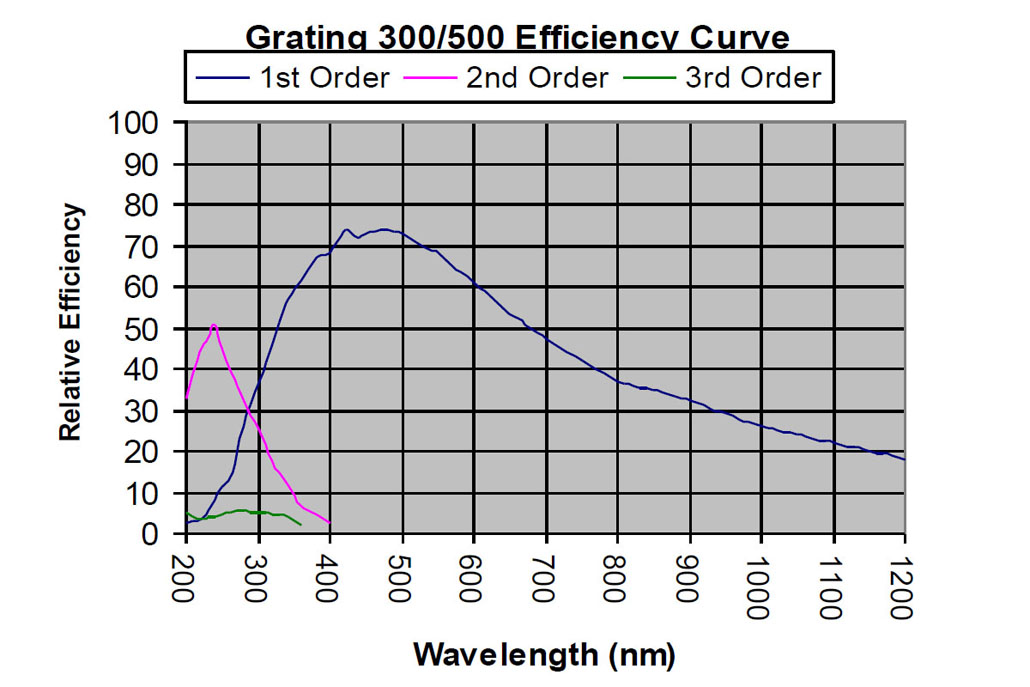
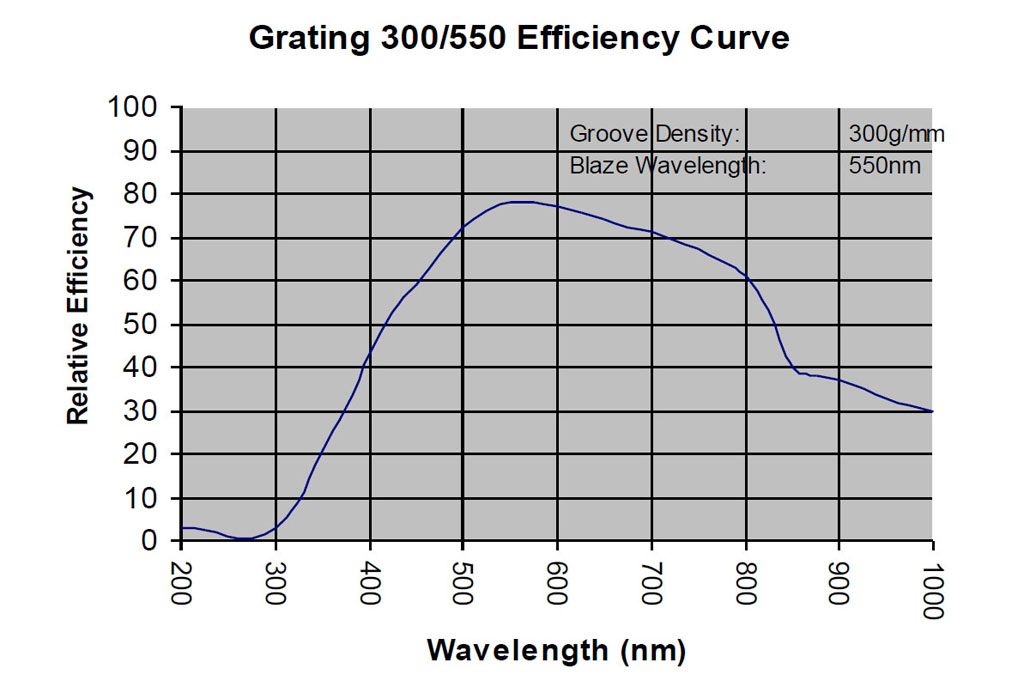
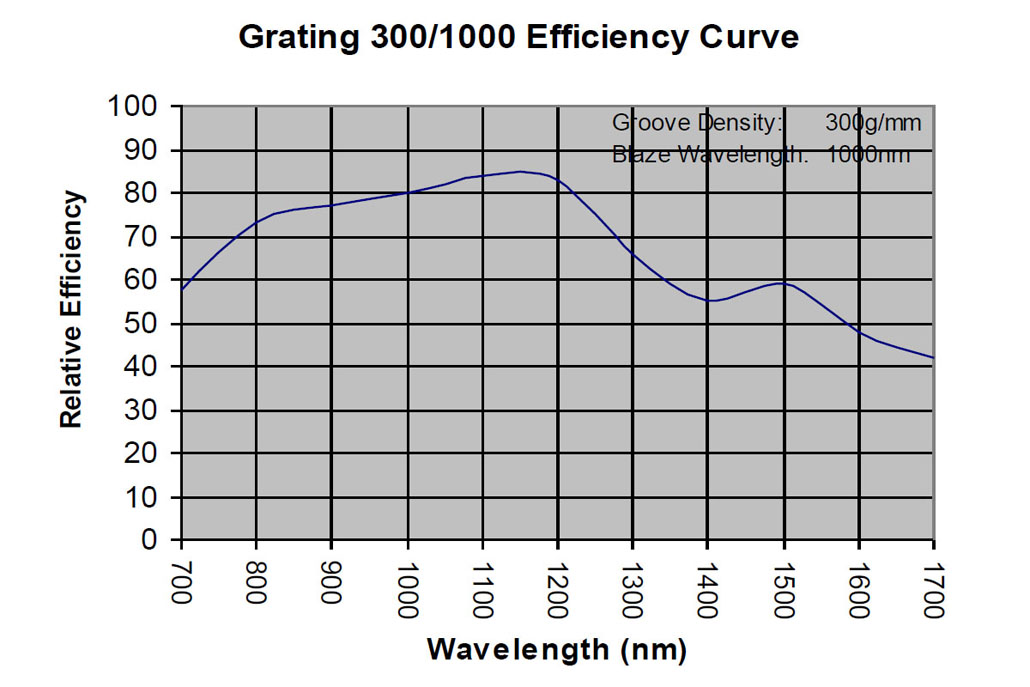
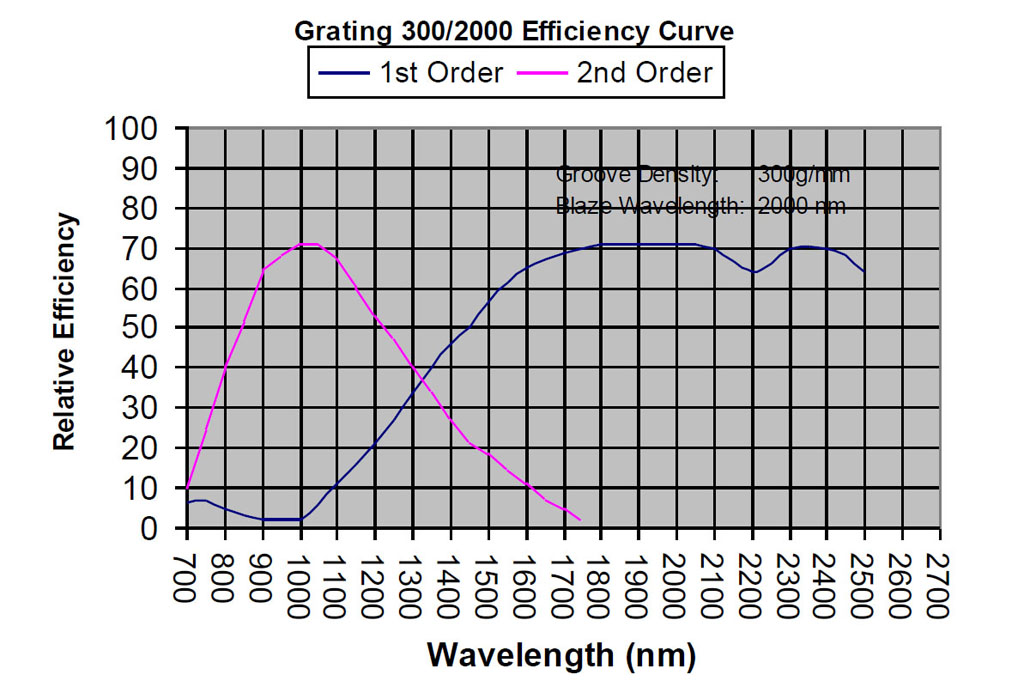
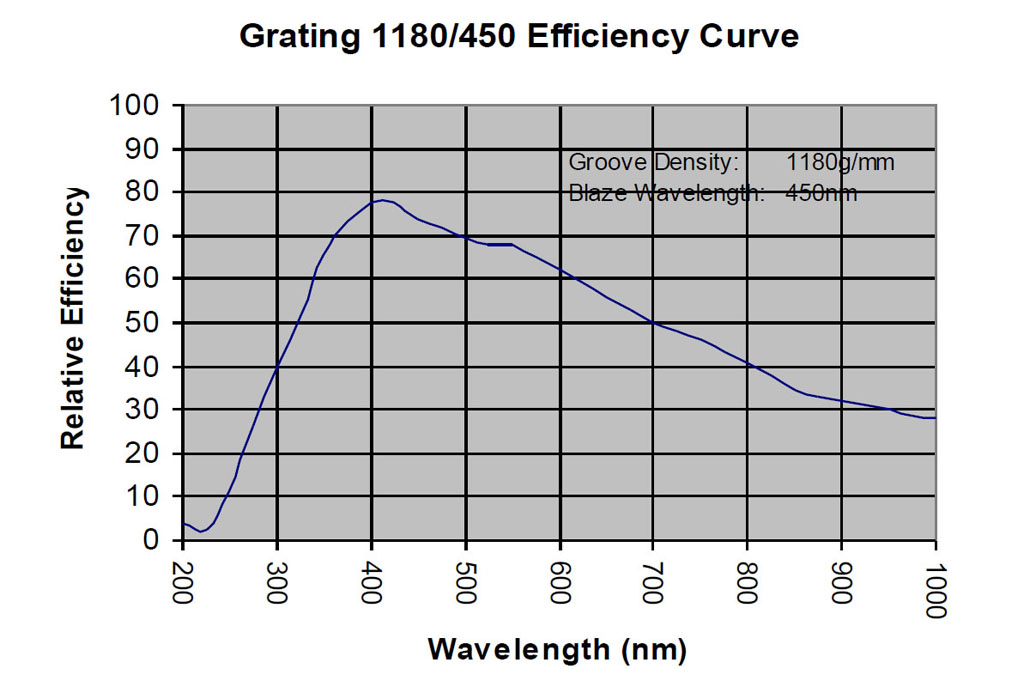
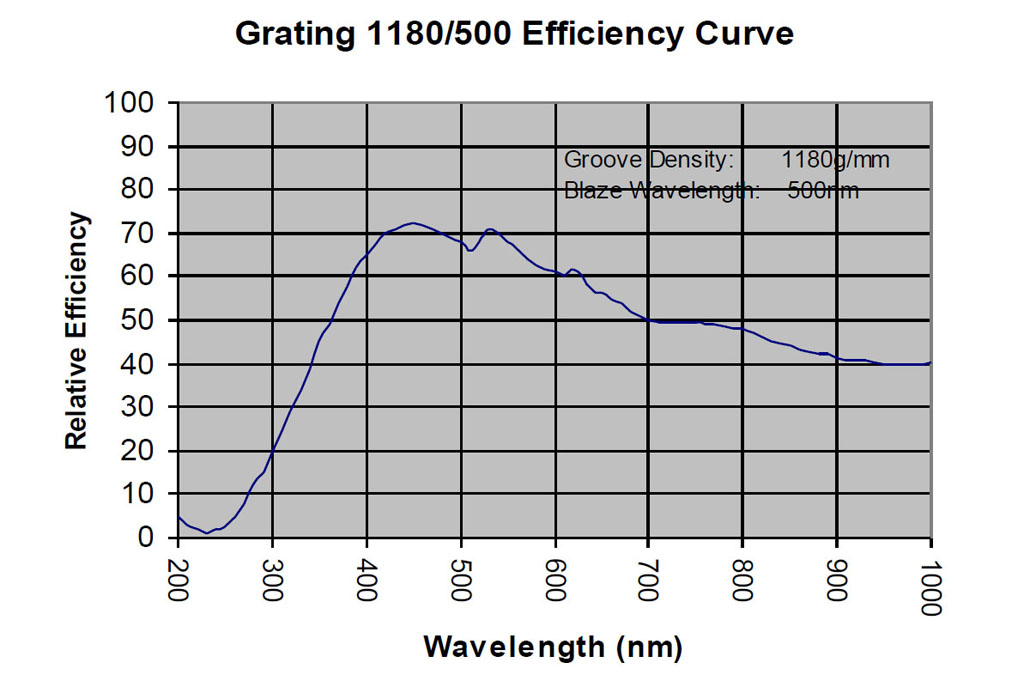
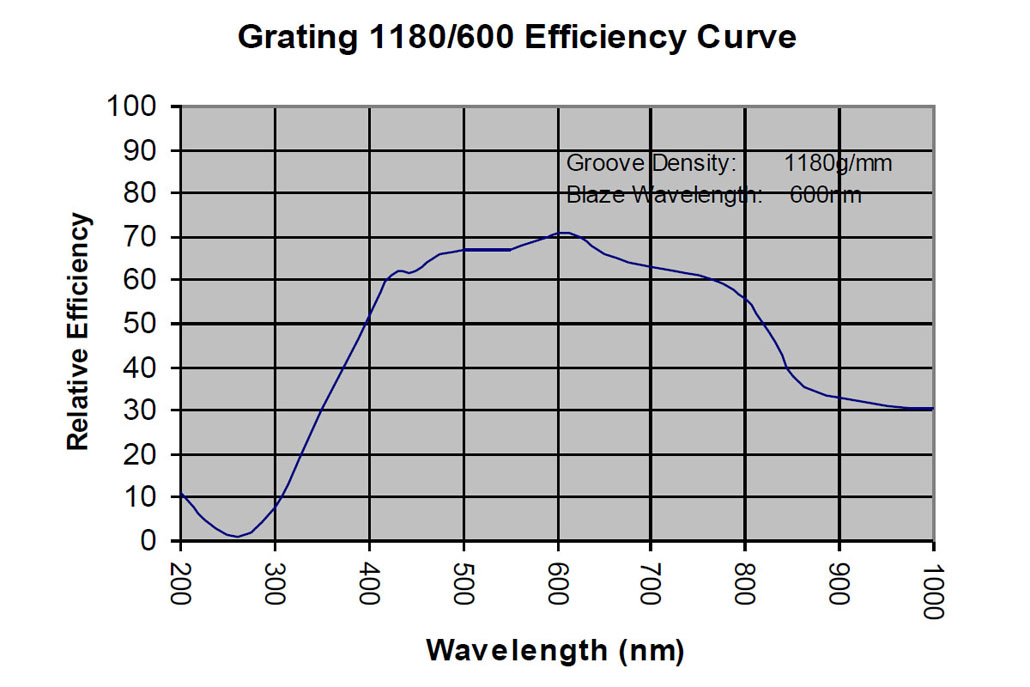
Our Typical Stock Grating Efficiency Curves
This list is a representative sample of our grating efficiency curves at various groove densities and blaze wavelengths. Scroll down the list or re-sort it by column, and click to see the graph of the curves.
This list is a representative sample of our grating efficiency curves at various Groove Densities and Blaze Wavelengths.
Either scroll down the list or re-sort the list by either column and click to see the graph of the curves.